

2020 November
-
BITCOIN The Fibonacci/MA combo shows a rocket is about to start!
- November 4, 2020
- Posted by: Tradingshot Articles
- Category: Cryptocurrency
No Comments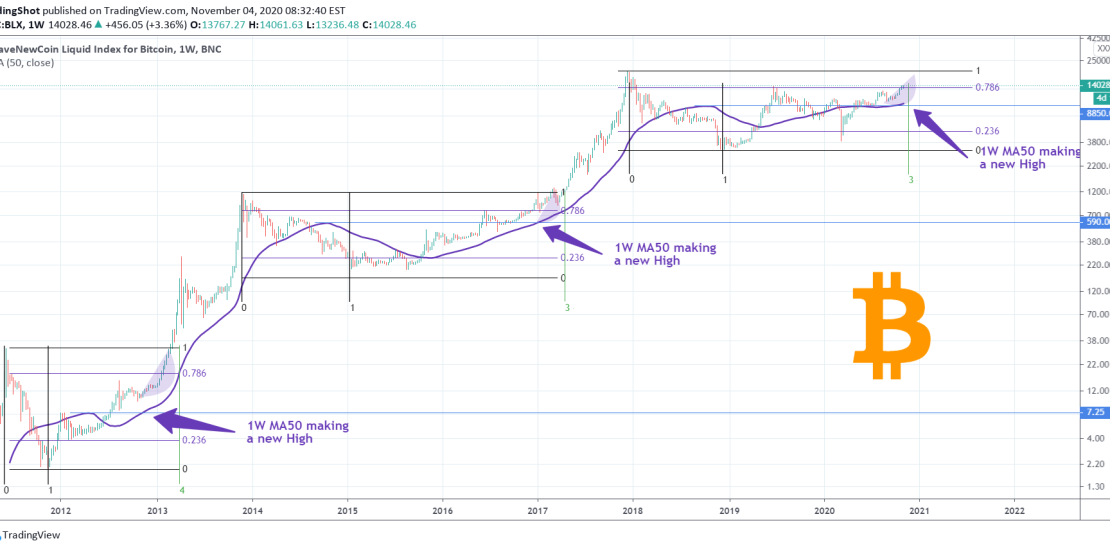
I will keep this simple and short. Every two simple parameters are filled, Bitcoin starts a parabolic bull run. Those are the MA50 making a new High on the 1W time-frame and trading above the 0.786 Fibonacci retracement level. That happened at least back in late 2012 and 2016. On present day, two weeks
-
S&P500 The elections can kickstart a +30% yearly rally!
- November 4, 2020
- Posted by: Tradingshot Articles
- Category: Stock Indices
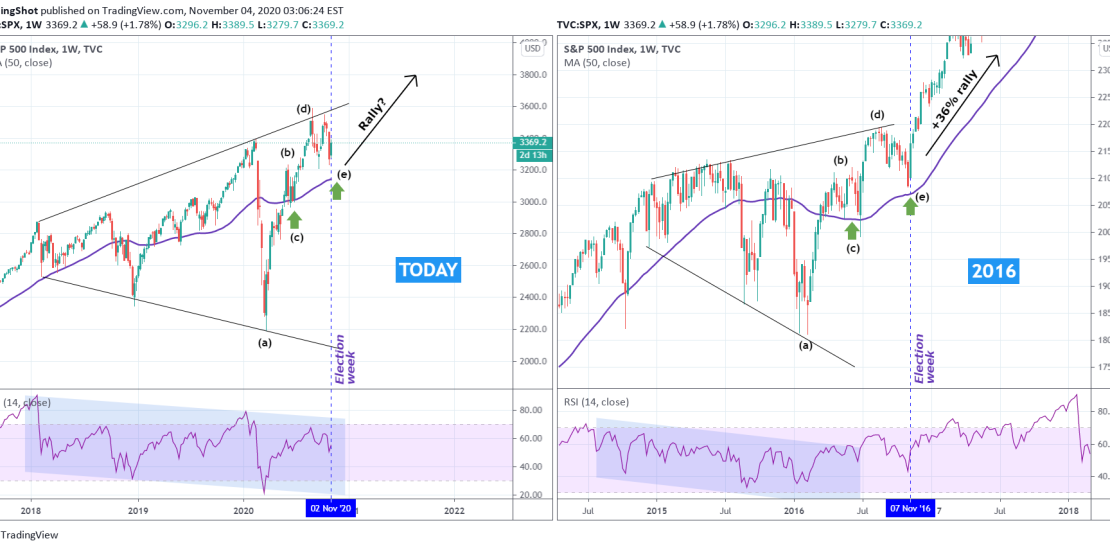
The chart comparison doesn’t need much explaining. I compare the price action on the 1W time-frame that led to the 2016 actions with today’s sequence. Both patterns are Megaphones on a descending RSI with the 1W MA50 (blue trend-line) acting as a Support on the Megaphones late stage. On the November 07 2016 1W
-
DOW JONES targeting 28650
- November 3, 2020
- Posted by: Tradingshot Articles
- Category: Stock Indices
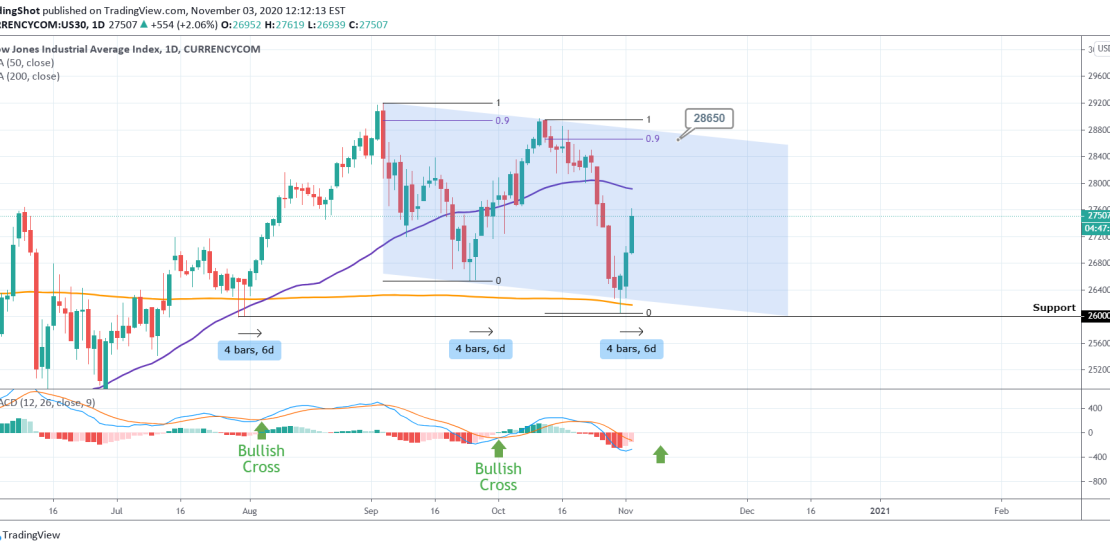
Dow rebounded 3 days ago on the 1D MA200 (orange trend-line). Since late July, this trend-line has been holding firmly as Support and every contact (with a candle week, no candle closing has been done below it), has resulted in a strong rise. Since the pattern is a Channel Down currently (since the September
-
S&P500 targeting 3500
- November 3, 2020
- Posted by: Tradingshot Articles
- Category: Stock Indices
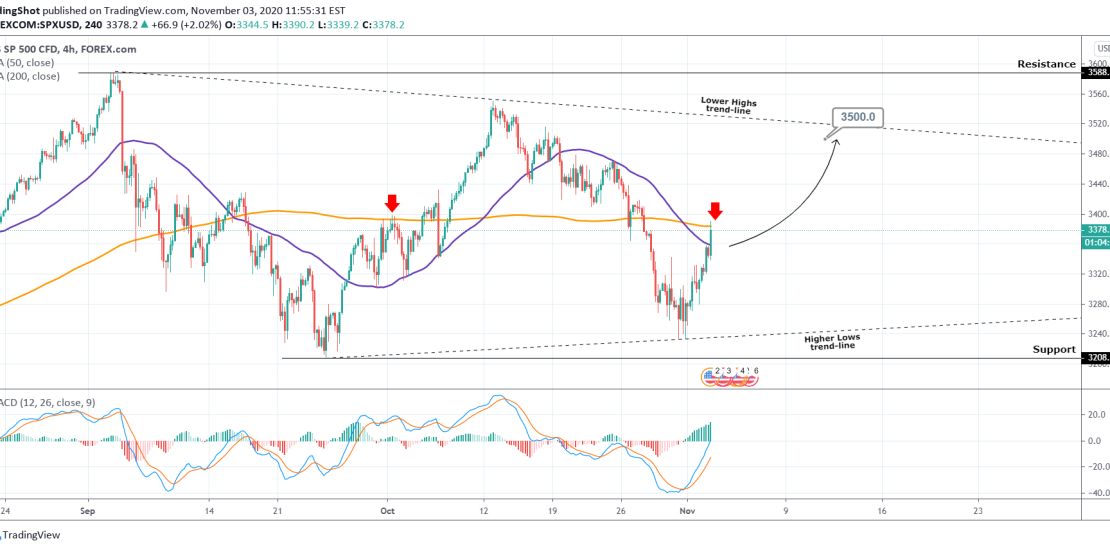
Pattern: Triangle on 4H. Signal: Buy on the next MA50 contact as the price breached the 4H MA200 as in October 01. Also the MACD made a strong Bullish Cross, similar in strength with the September 24 – 29. Target: 3500 (potential contact on the Lower High trend-line of the pattern). Most recent S&P
-
U.S. DOLLAR INDEX Is it about to crack below 90.00?
- November 3, 2020
- Posted by: Tradingshot Articles
- Category: Forex
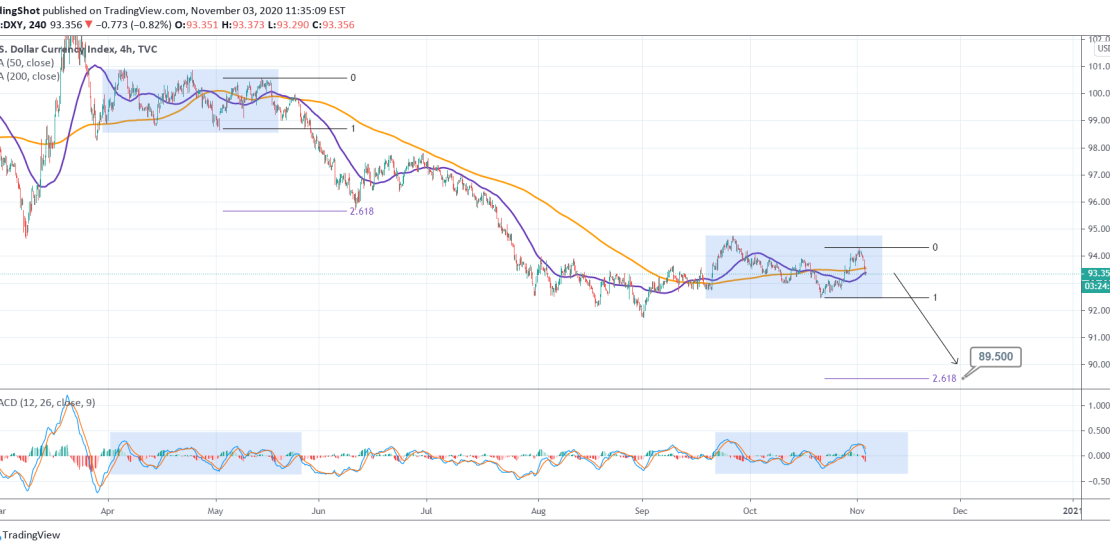
Scary as it may seem, the price action on the recent consolidation, along with the MACD, have formed on the 4H chart a pattern much similar with the April-May sequence that led to the collapse of June and July. The first low before the recent Bottom was made on the 2.618 Fibonacci extension, as
-
DAX targeting 13000 if the 1D MA200 breaks (3 year pattern)
- November 3, 2020
- Posted by: Tradingshot Articles
- Category: Stock Indices
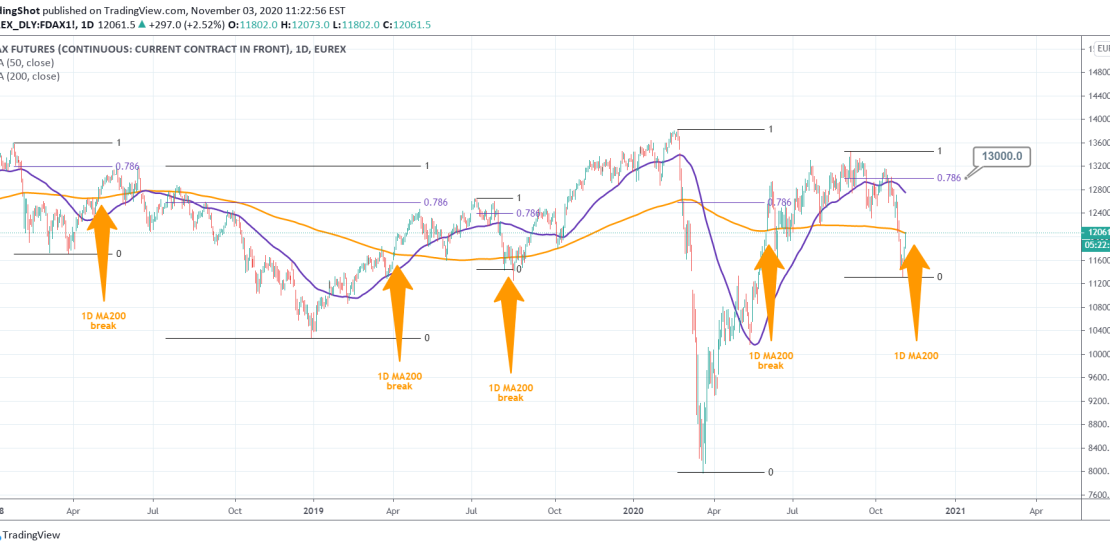
This is an interesting 3 year pattern for DAX. Since 2018, every time the 1D MA200 breaks as a Resistance (index closes one 1D candle above it), DAX rallies to at least the 0.786 Fibonacci retracement level of the previous Top. Right now we are testing the 1D MA200 and the 0.786 is at
- 1
- 2