

2019
-
USDPLN Buy Signal
- September 19, 2019
- Posted by: Tradingshot Articles
- Category: Uncategorized
No Comments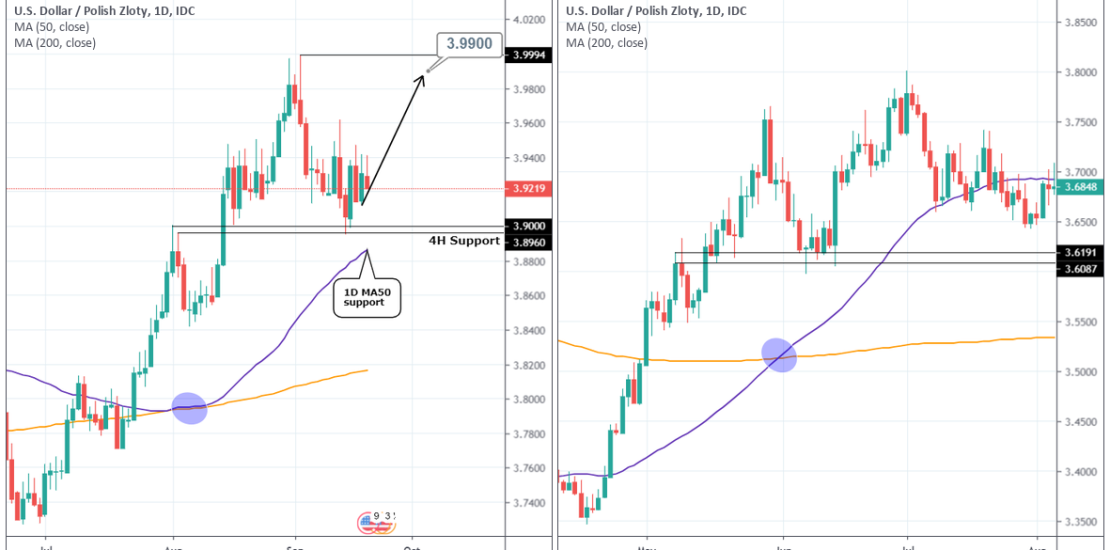
Pattern: Head and Shoulders on 1D. Signal: Bullish as the Right Shoulder formation bounced on the 4H Support. Target: 4.9900 (just below the Resistance). Tradingview link: https://www.tradingview.com/chart/USDPLN/g7lUlW28-USDPLN-Buy-Signal
-
NOKSEK 09/16/2019
- September 16, 2019
- Posted by: Tradingshot Articles
- Category: Uncategorized
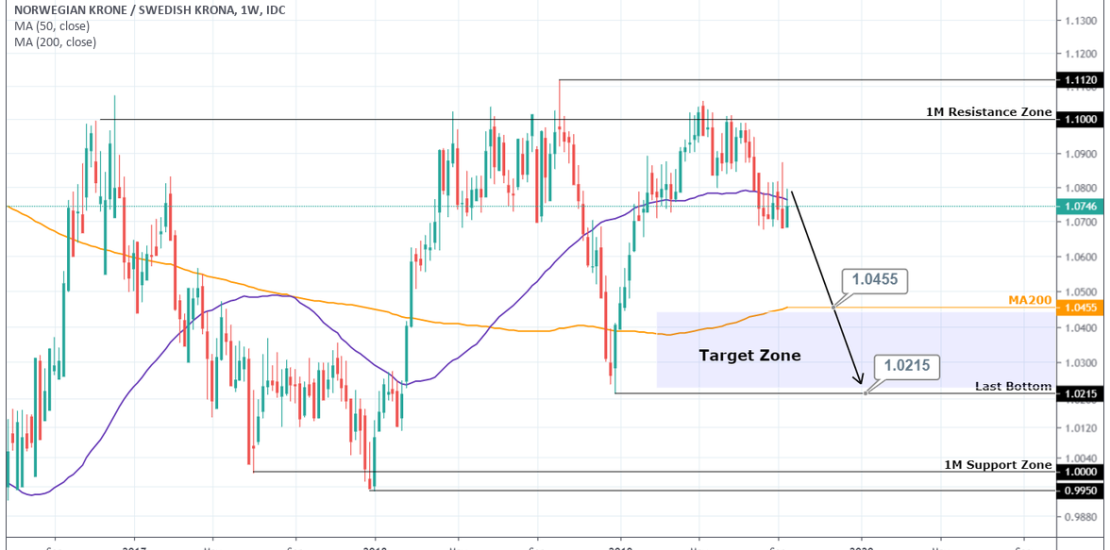
Pattern: Rectangle on 1M. Signal: Bearish as the price was rejected on the 1M Resistance Zone. Target: 1.0455 and 1.0215 in extension. Tradingview link: https://www.tradingview.com/chart/NOKSEK/iKhAzXMV-NOKSEK-09-16-2019
-
LITECOIN Found support on 1W MA50. Will history repeat itself?
- September 13, 2019
- Posted by: Tradingshot Articles
- Category: Uncategorized
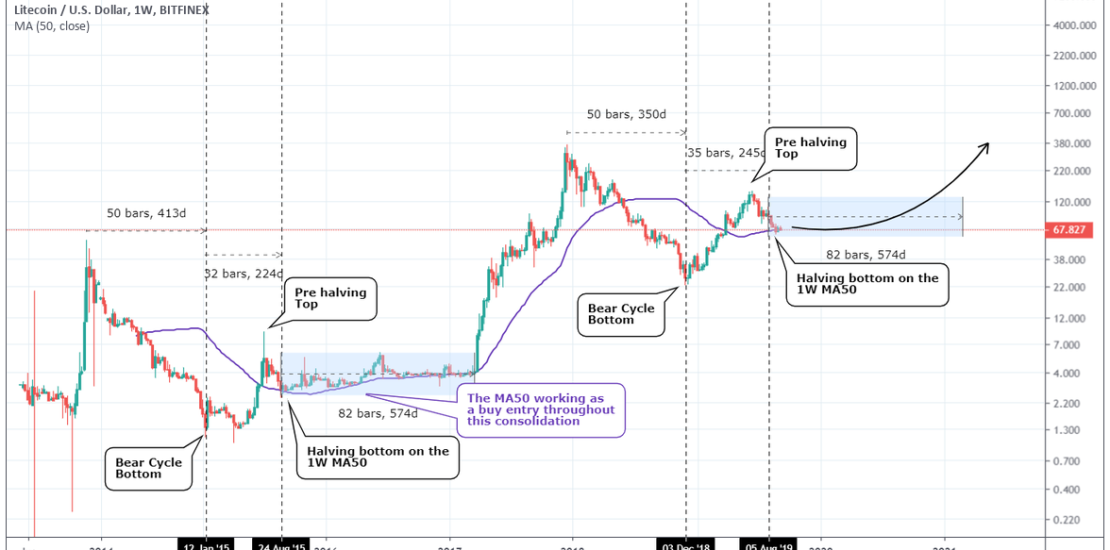
The title really says it all. LTC is trading around the 1W MA50 on a possible mid term support event for the current Bull Cycle, which is methodically repeating the 2015 sequence. This MA period previously held throughout 2015 – early 2017 up until Litecoin initiated its super strong rise to the mid $300s peak.
-
ETHEREUM following BITCOIN’s first cycle?
- September 9, 2019
- Posted by: Tradingshot Articles
- Category: Cryptocurrency
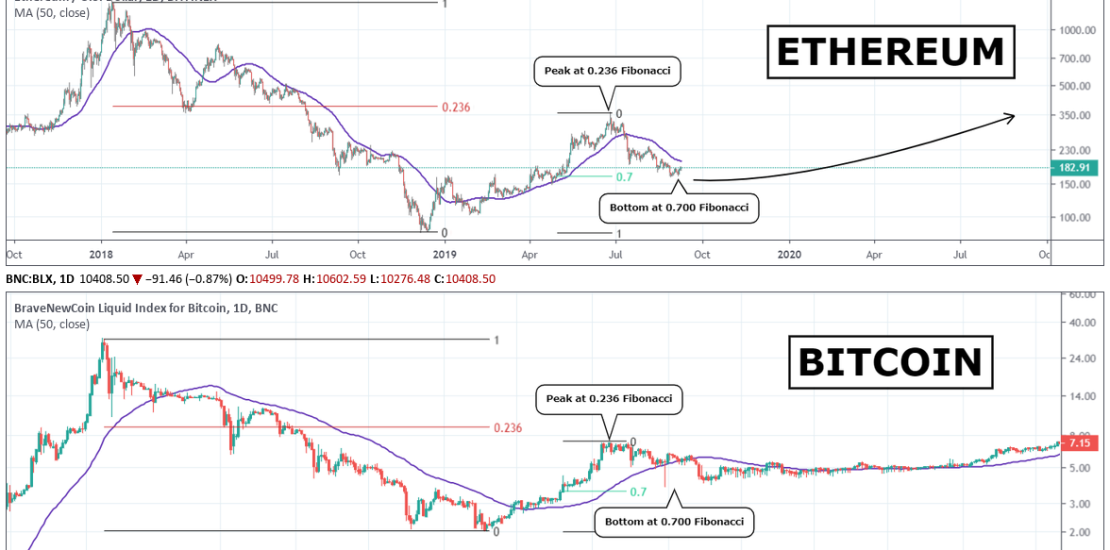
Well the title says it all, but can it really be? Ethereum currently following Bitcoin’s first cycle (2011/ 2012)? This is a simplistic yet interesting comparison of the two cycles. After BTC’s 2011 bottom, the price peaked near the 0.236 Fibonacci retracement. Then it pulled back again but found support on the 0.700 Fibonacci retracement
-
USDDKK Buy Signal
- September 6, 2019
- Posted by: Tradingshot Articles
- Category: Forex
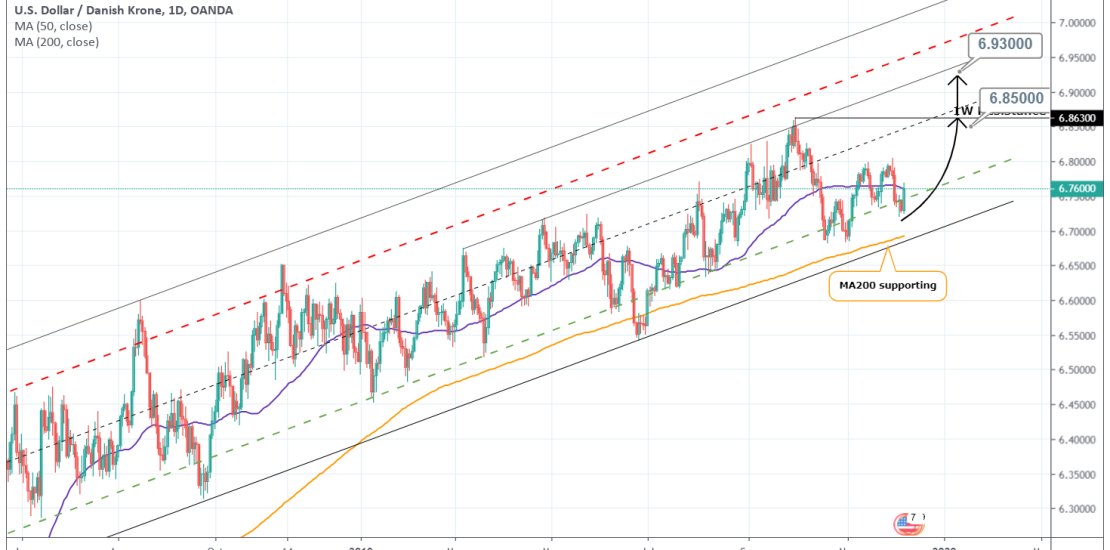
Pattern: Channel Up on 1M. Signal: Bullish as the price is on the Higher Low zone of the Channel Up, supported by the 1D MA200. Target: 6.8500 (just below the 1W Resistance) and if the 1W R breaks 6.9300 (projected Higher High). Tradingview link: https://www.tradingview.com/chart/USDDKK/GcyQ9q2O-USDDKK-Buy-Signal
-
WTI OIL Bullish Trading plan
- September 5, 2019
- Posted by: Tradingshot Articles
- Category: Commodities
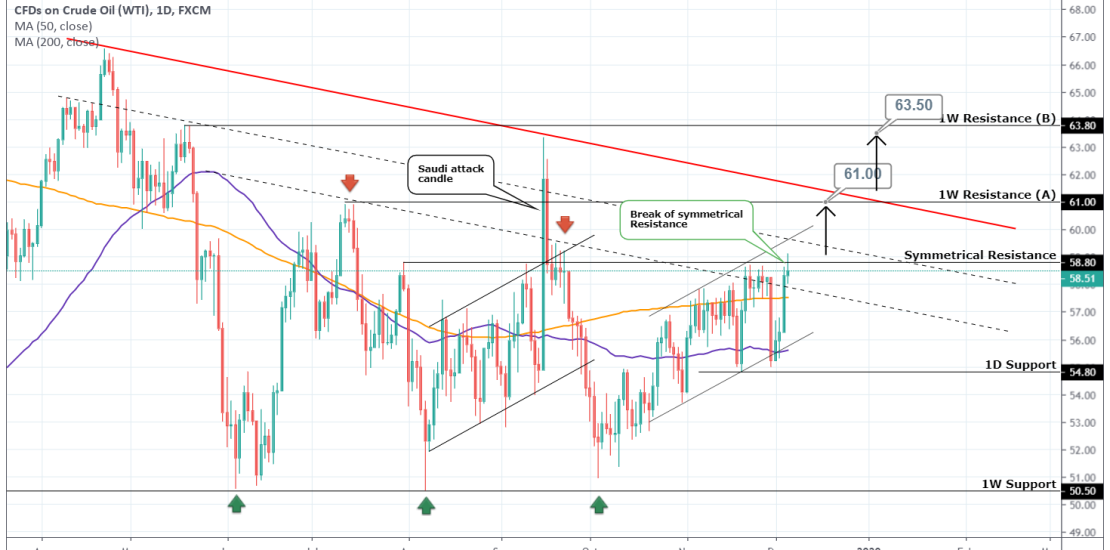
Pattern: 1D Channel Up. Signal: Bullish as the price broke the 58.80 Symmetrical Resistance, which (excluding the Saudi attack on September 16th) has been holding since July. Target: 61.00 (1st 1W Resistance) and if the Lower High trend line (red bold) of the Descending Triangle breaks, 63.50 (2nd 1W Resistance). See how accurate the 1W
-
ETHUSD Buy Signal
- September 4, 2019
- Posted by: Tradingshot Articles
- Category: Uncategorized
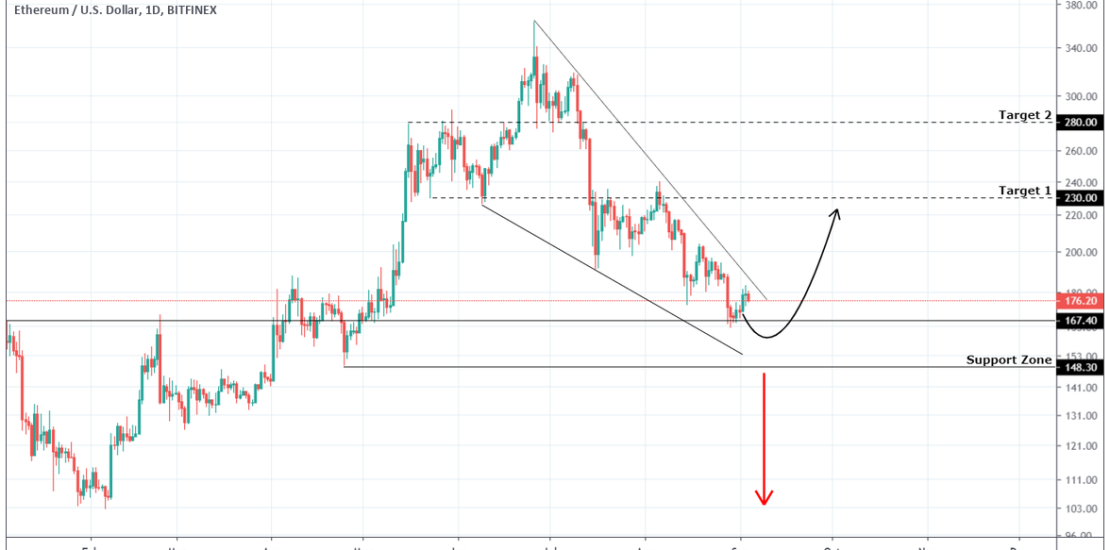
Pattern: 1D Falling Wedge. Signal: Bullish as the price is approaching the Support Zone and the pattern is close to exhaustion. Target: 230.00 and 280.00 in extension. Trandingview link: https://www.tradingview.com/chart/ETHUSD/dDm18zGK-ETHUSD-Buy-Signal
-
PLATINUM Buy Signal
- September 4, 2019
- Posted by: Tradingshot Articles
- Category: Commodities
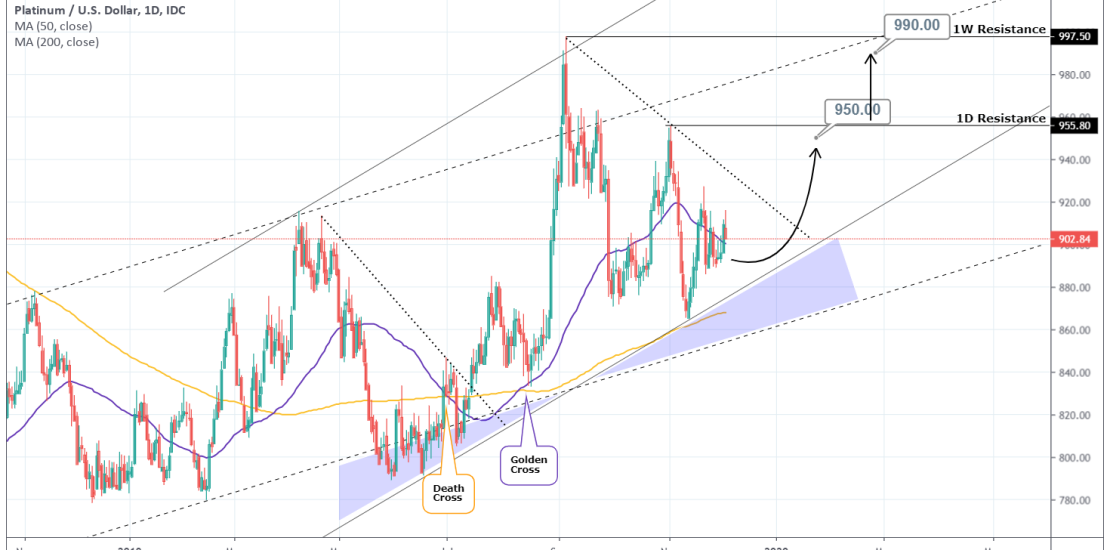
Pattern: Channel Up on 1M. Signal: Bullish as the price is approaching the Higher Low zone of the pattern. Target: 950 (below the 1D Resistance) and 990 (below the 1W Resistance). Tradingview link: https://www.tradingview.com/chart/XPTUSD/IoyZSGUi-PLATINUM-Buy-Signal
-
NZDSGD Buy Signal
- September 3, 2019
- Posted by: Tradingshot Articles
- Category: Uncategorized
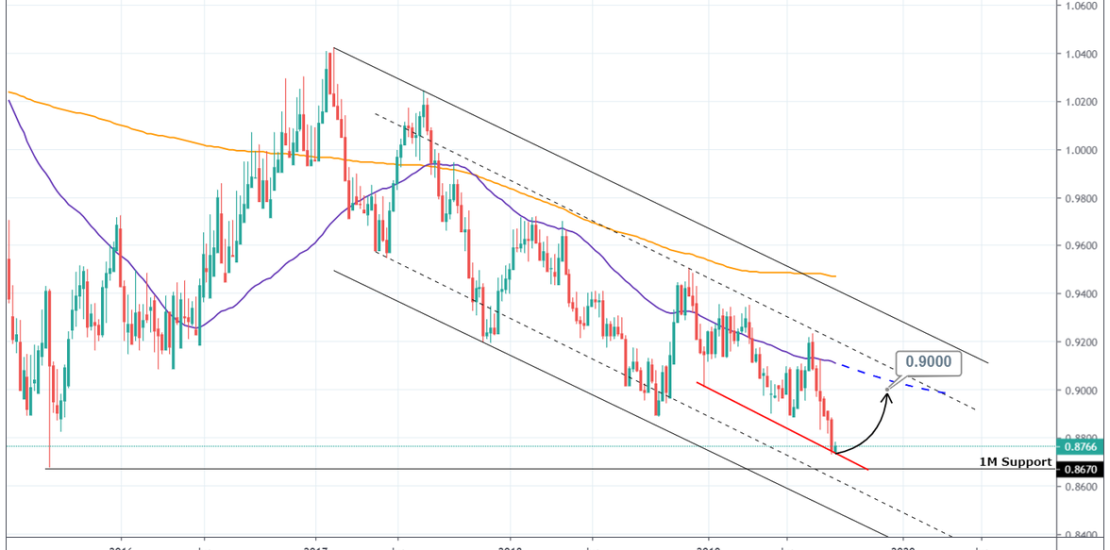
Pattern: 1M Channel Down. Signal: Bullish as the price is close to the 1M Support and is making a Lower Low on the inner Channel Down. Target: 0.9000 (projected contact with the MA50). Tradingview link: https://www.tradingview.com/chart/NZDSGD/eu1GzBK7-NZDSGD-Buy-Signal
-
COPPER Buy Signal
- September 2, 2019
- Posted by: Tradingshot Articles
- Category: Commodities
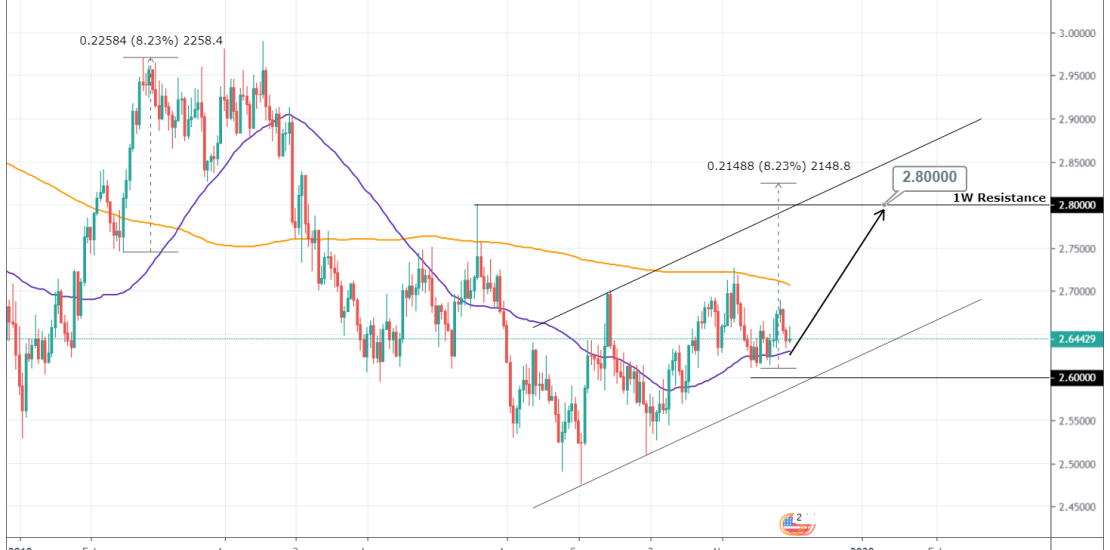
Pattern: Channel Up on 1D. Signal: Bullish as long as the 2.6000 level holds (Higher Low lim). Target: 2.8000 (1W Resistance). Tradingview link: https://www.tradingview.com/chart/XCUUSD/1RNtvoCT-COPPER-Buy-Signal