

2019
-
NZDCHF Buy Signal
- October 21, 2019
- Posted by: Tradingshot Articles
- Category: Uncategorized
No Comments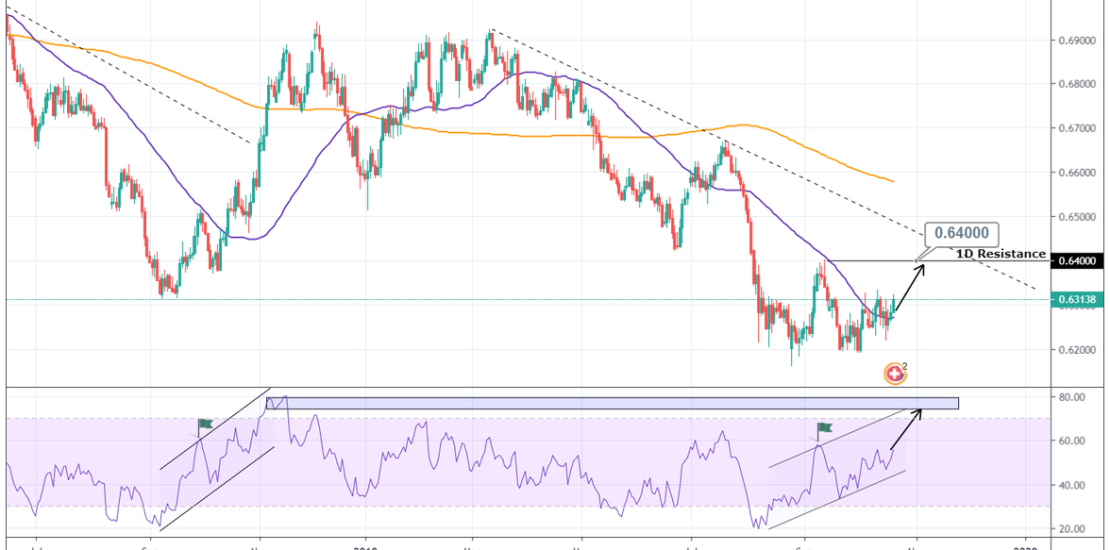
Pattern: Channel Up on 1D. Signal: Bullish due to an identical RSI occurrence. Target: 0.6400 (1D Resistance). Tradingview link: https://www.tradingview.com/chart/NZDCHF/2IreLLGx-NZDCHF-Buy-Signal
-
BITCOIN Will it make 5 straight RED MONTHS before rebounding?
- October 18, 2019
- Posted by: Tradingshot Articles
- Category: Cryptocurrency
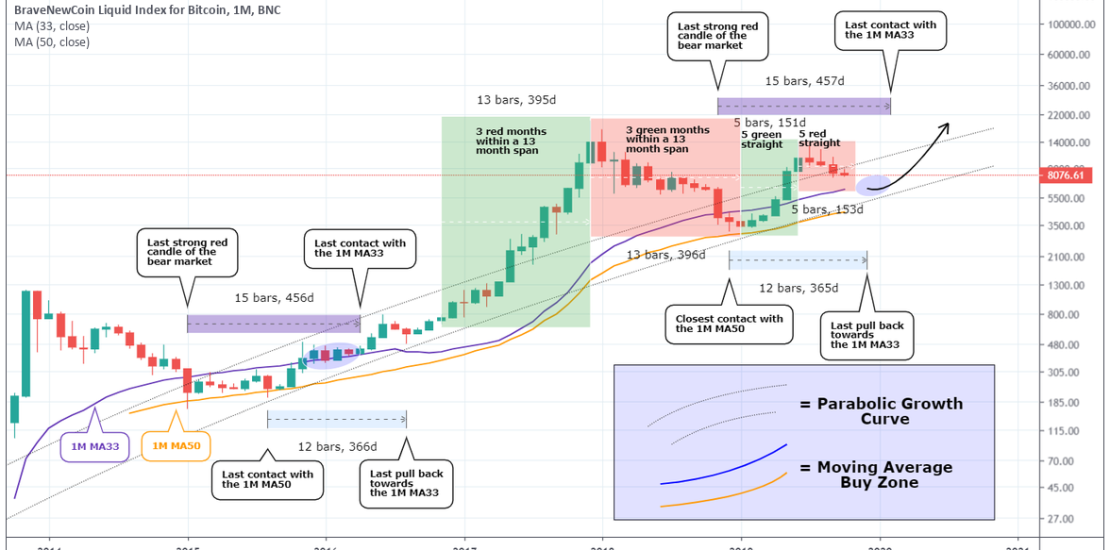
My recent long term analyses on Bitcoin were focused on the $6000 region as a potential buy and more particularly the demand zone that certain Moving Averages (among other technical indicators) provided around this region. The first studies were centered on the 1D and 1W time frames (shown just below), this time I take it
-
EURUSD Sell Signal (long term)
- October 18, 2019
- Posted by: Tradingshot Articles
- Category: Uncategorized
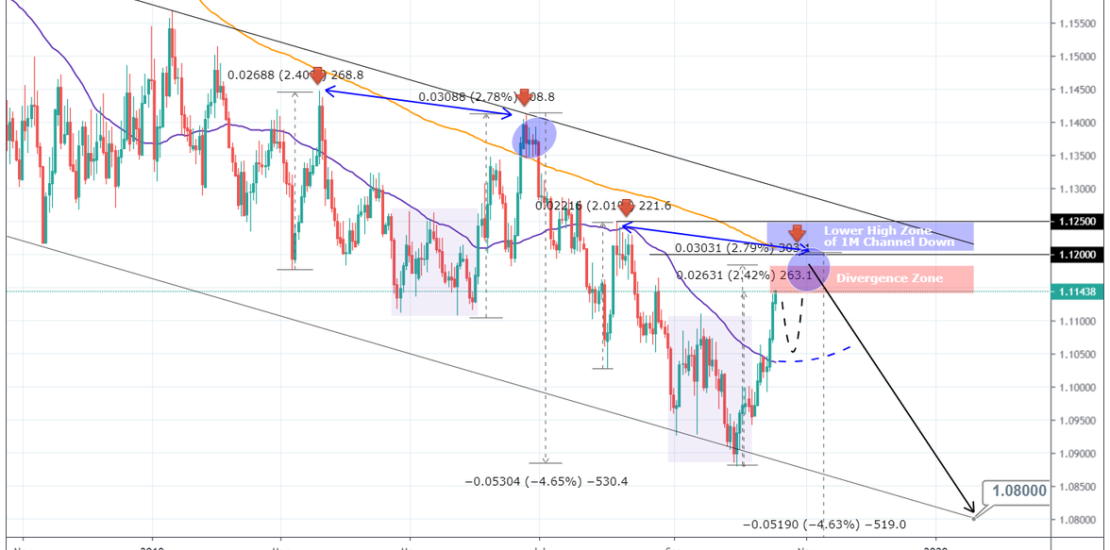
Pattern: Channel Down on 1M. Signal: Bearish as the price has entered the Lower High divergence zone (if the current is also -0.40% lower from the March – June Lower High range). Target: 1.0800 (even though the -4.65% extension can go as low as 1.0700). NOTE: The same pattern has been followed in the
-
DOW JONES Buy Signal
- October 17, 2019
- Posted by: Tradingshot Articles
- Category: Stock Indices
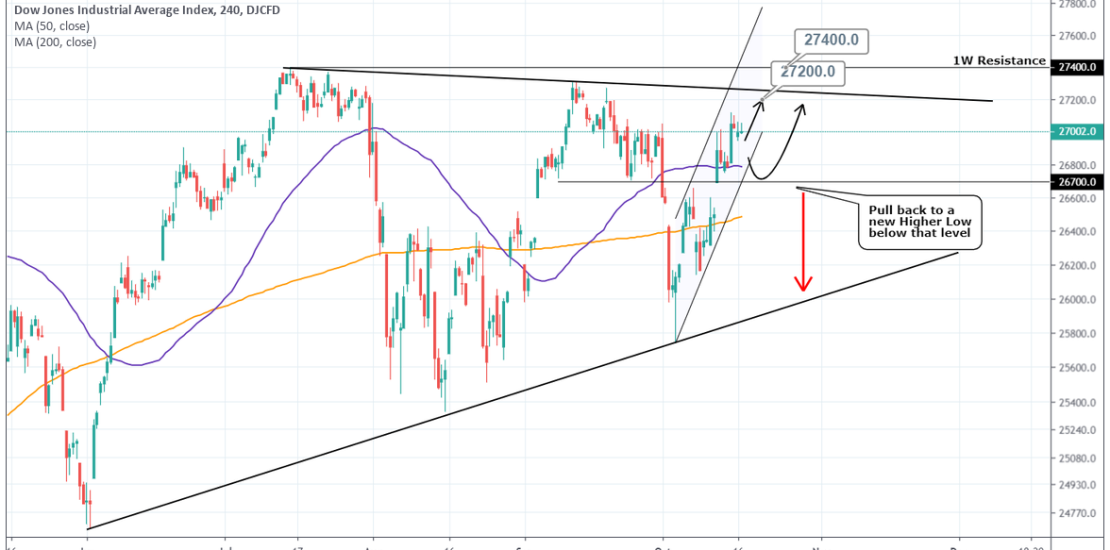
Pattern: 4H Channel Up. Signal: Bullishas the price is near the Higher Low region. Target: 27200 (Lower High of the 1W Triangle) and 27400 in extension (1W Resistance) Tradingview link: https://www.tradingview.com/chart/DJI/TvrQ5jAD-DOW-JONES-Buy-Signal
-
USDHUF Buy Signal
- October 17, 2019
- Posted by: Tradingshot Articles
- Category: Uncategorized
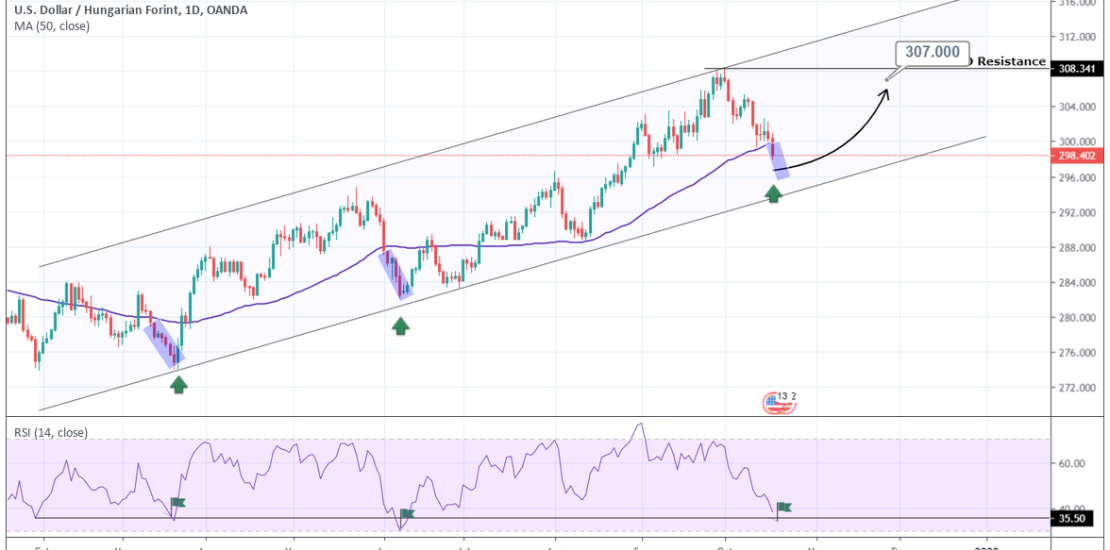
Pattern: Channel Up on 1W. Signal: Bullish as the price broke below the 1D MA50. Target: 307.000 (just under the 1D Resistance). Tradingview link: https://www.tradingview.com/chart/USDHUF/utm6d7i9-USDHUF-Buy-Signal
-
XTZBTC Buy Signal. Big upside potential.
- October 17, 2019
- Posted by: Tradingshot Articles
- Category: Uncategorized
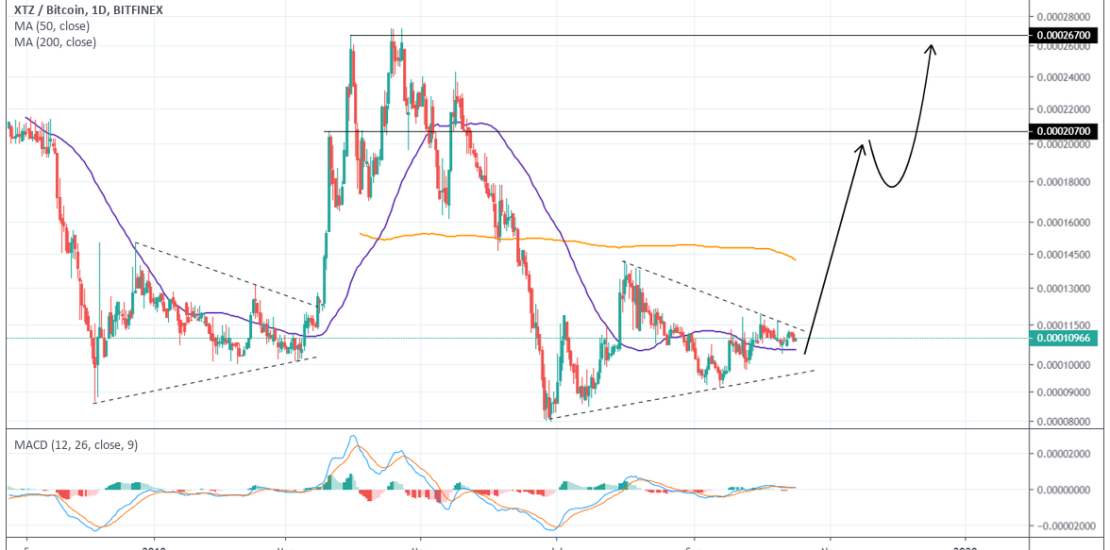
Pattern: Triangle on 1D. Signal: Bullish as the pattern is about to break out to the upside on a similar manner to the early 2019 formation. Target: 0.000207 and 0.000267 in extension. Tradingview link: https://www.tradingview.com/chart/XTZBTC/hXxIbyg2-XTZBTC-Buy-Signal-Big-upside-potential
-
XTZUSD Buy Signal
- October 17, 2019
- Posted by: Tradingshot Articles
- Category: Uncategorized
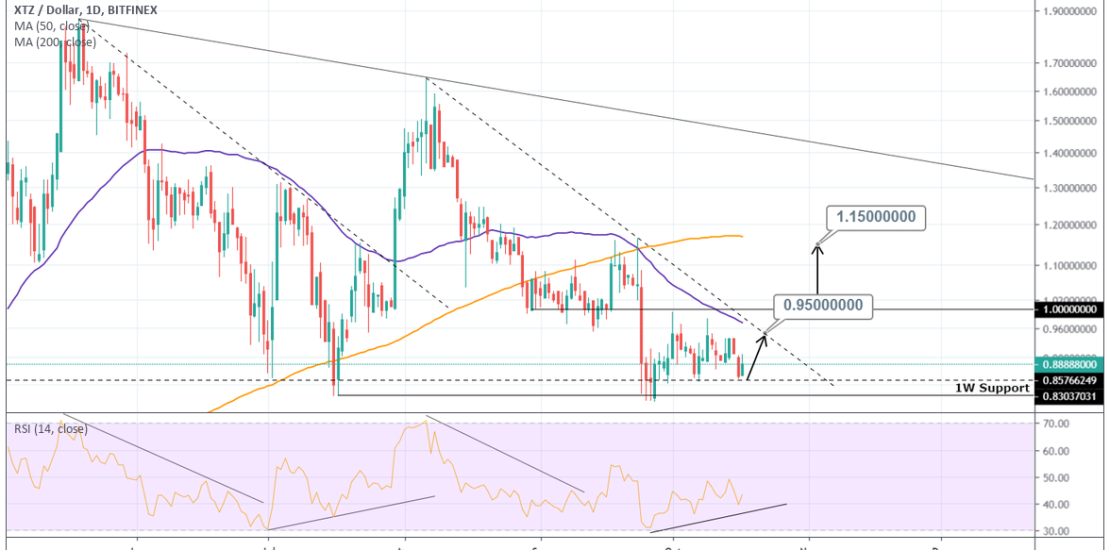
Pattern: 1W Descending Triangle. Signal: Bullish as the price is bouncing on the Support. Target: 0.9500 and if 1.0000 breaks extension to 1.1500 possible. Tradingview link: https://www.tradingview.com/chart/XTZUSD/YHFqwKzG-XTZUSD-Buy-Signal
-
ALTCOIN MARKET RSI Bullish divergence aiming initially at 81B
- October 15, 2019
- Posted by: Tradingshot Articles
- Category: Uncategorized
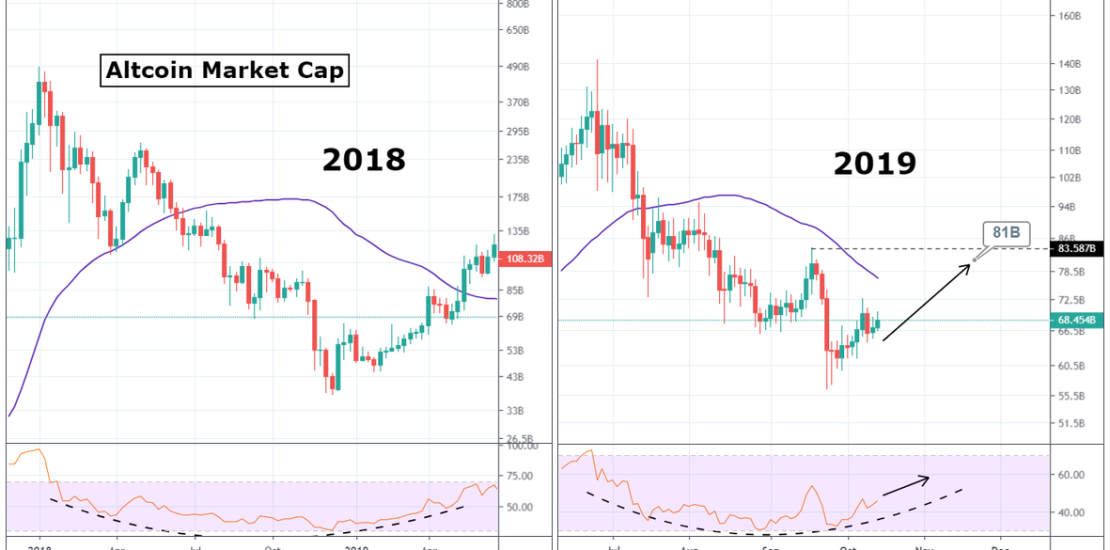
I am comparing the 2018 Alt Market Cap on 1W with the current (June 2019 – date) on 2D. There are some obvious similarities with the most significant of all the bullish divergence on the RSI. The MA50 is also on the same pattern while the candle action is nearly identical. Because of this I
-
TRXUSD Is it repeating this pattern?
- October 14, 2019
- Posted by: Tradingshot Articles
- Category: Uncategorized
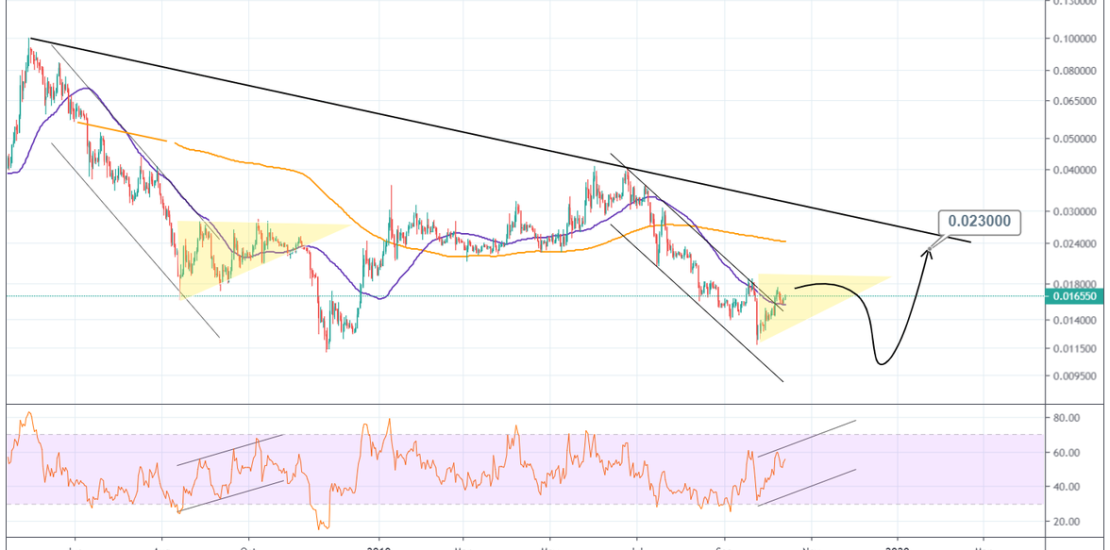
Based on the RSI divergence and how the 1D MA50 and MA200 are trading, then yes it is possible that TRON is repeating the August – November 2018 sequence. The current Triangle is completed with one last dip towards 0.01000, which will be the opportunity for buyers to step in. Moderate Target: 0.023000. Tradingview link:
-
GBPSEK Buy Signal
- October 7, 2019
- Posted by: Tradingshot Articles
- Category: Uncategorized
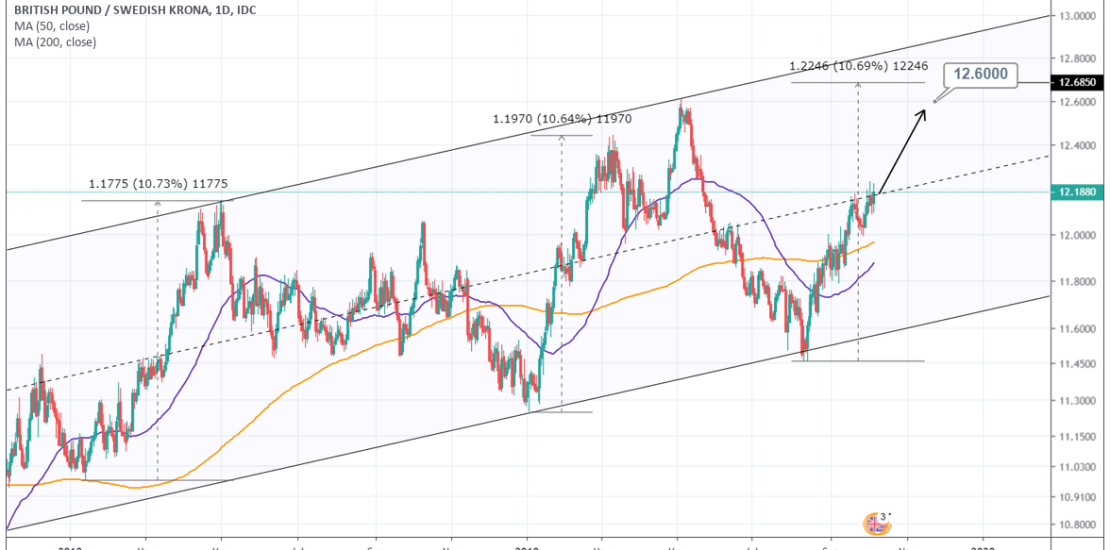
Pattern: 1M Channel Up. Signal: Bullish since it broke the middle of the Channel after a rebound on the Higher Low. Tradingview link: https://www.tradingview.com/chart/GBPSEK/tZaz7eUY-GBPSEK-Buy-Signal