

2019
-
GBPNOK Sell Signal
- May 15, 2019
- Posted by: Tradingshot Articles
- Category: Uncategorized
No Comments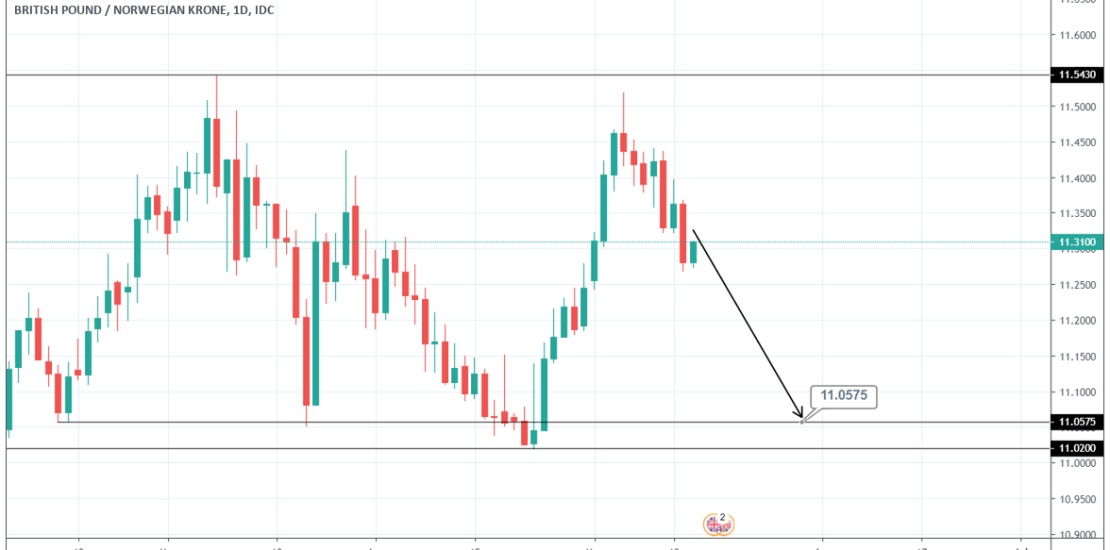
Pattern: Rectangle on 1D. Signal: Bearish after the price was rejected near the 1D Resistance. Target: 11.0575 (top of the 1D Support Zone). Tradingview link: https://www.tradingview.com/chart/GBPNOK/0ZmA7cqf-GBPNOK-Sell-Signal/
-
DASHUSD Buy Signal
- May 14, 2019
- Posted by: Tradingshot Articles
- Category: Uncategorized
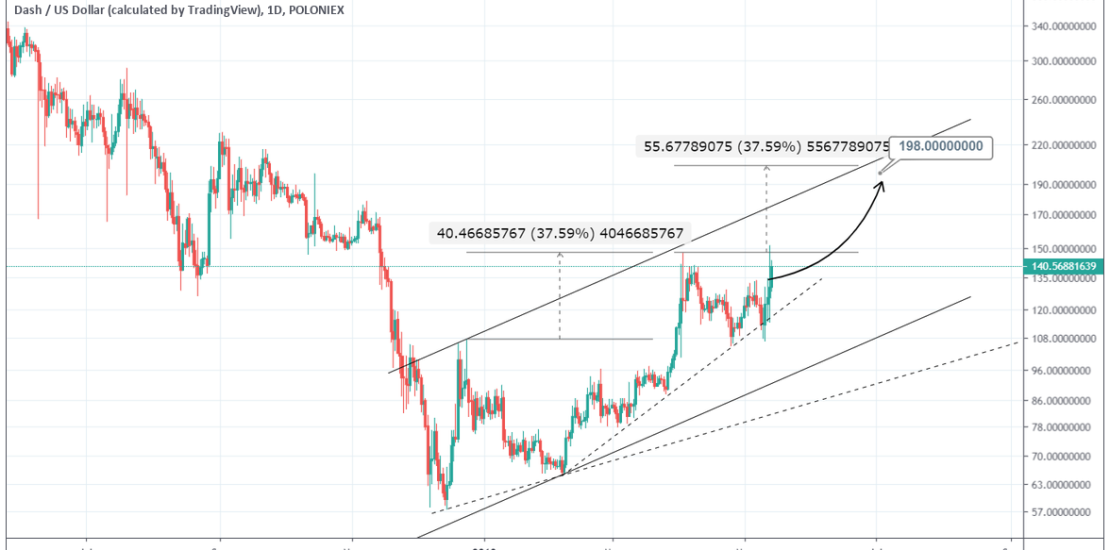
Pattern: 1W Channel Up. Signal: Bullish as every pull back is supported on both inner and outer Higher Lows. Target: 198.000 (structured Higher High growth rate). Tradingview link: https://www.tradingview.com/chart/DASHUSD/S0chRb3r-DASHUSD-Buy-Signal/
-
Is this time different? 2019 & 2015 after breaking the 1W MA100.
- May 13, 2019
- Posted by: Tradingshot Articles
- Category: Uncategorized
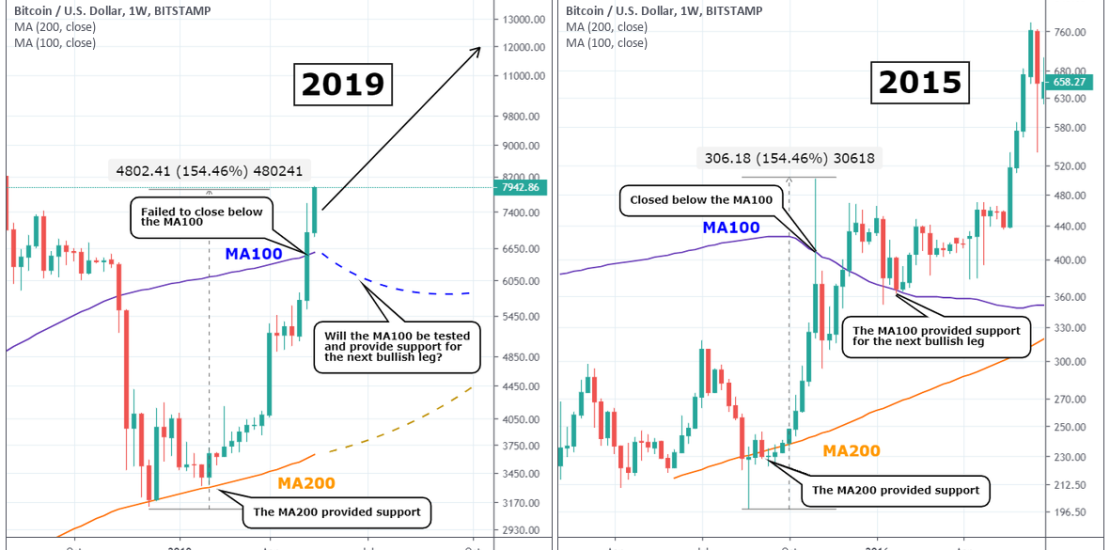
The title says everything. I don’t want to get into much detail. Just want to point out the similarities and differences of the two time periods when Bitcoin broke the 1W MA100 after the market made a bottom. Note that it is not necessary to follow the exact same pattern as the fundamentals this time
-
XRPUSD 100% Success on this Fibonacci pattern
- May 10, 2019
- Posted by: Tradingshot Articles
- Category: Uncategorized
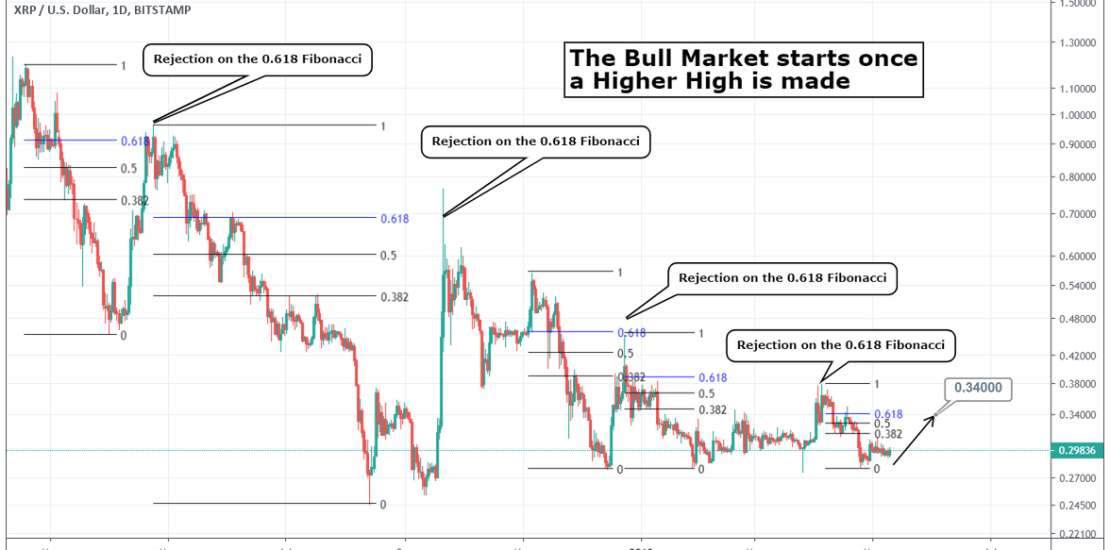
XRP is currently consolidating after its late April bottom. Since February 2018 it has been making Lower Highs. Quite interestingly every High that followed and top made, it was rejected roughly on the 0.618 Fibonacci retracement level of the previous High to bottom. So far we can count 4 successful incidents in the last year,
-
GOLD to BTC: “Don’t miss this bull, we’re just getting started!”
- May 5, 2019
- Posted by: Tradingshot Articles
- Category: Uncategorized
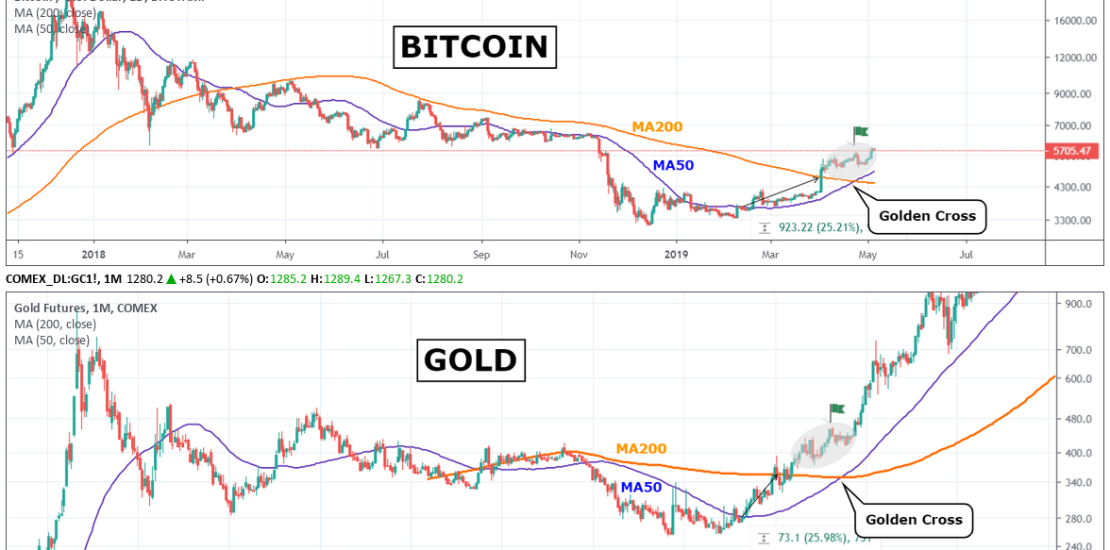
Comparing Bitcoin to Gold?? That can’t give you any meaningful trade indication can it? Well first of all look at the perfect buy signal it gave back in December, which I posted in February, on that +33.50% bounce from the low. Right when everyone was wondering where the bottom was, “Should I buy?”, “Is this
-
BITCOIN Bullish indicators that have never failed!
- April 30, 2019
- Posted by: Tradingshot Articles
- Category: Uncategorized
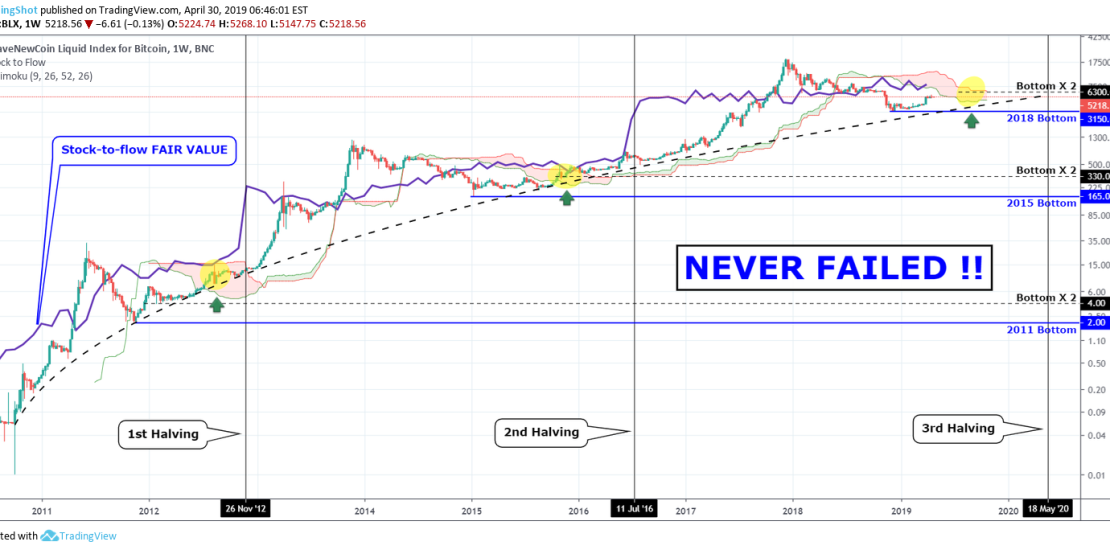
Due to the price difference on exchanges, a lot of the attention lately is being drawn away from what matters most. Is the worst over for BTC? Has the new bull cycle started? With this as motive, I thought it would be productive to accumulate the strongest long term bullish indicators on Bitcoin. And I
-
USDRON Short Signal
- April 28, 2019
- Posted by: Tradingshot Articles
- Category: Uncategorized
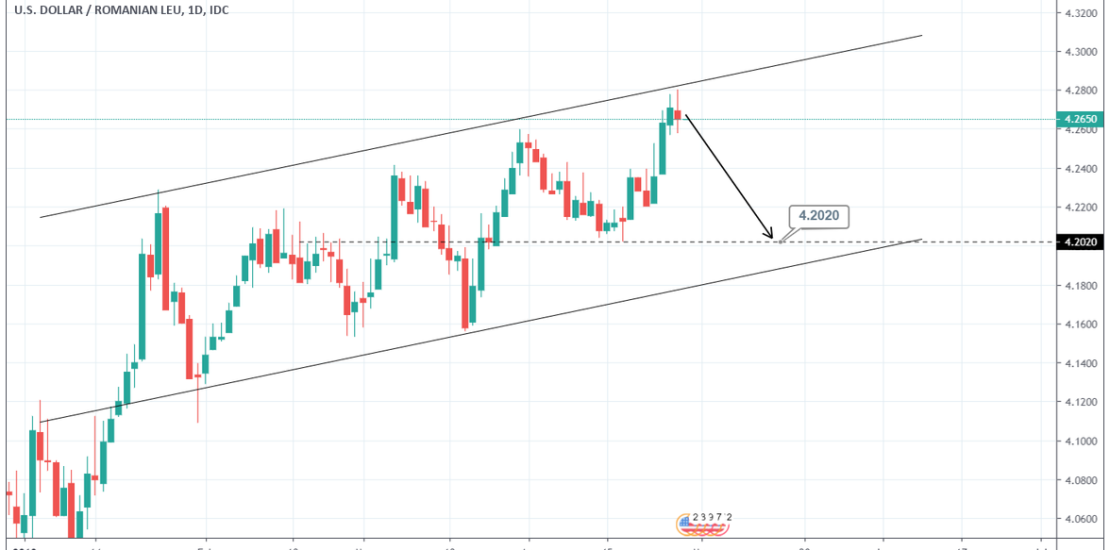
Pattern: Channel Up on 1D. Signal: Bearish after a Higher High was made at 4.2800. Target: 4.2020 (potential Higher Low and Support). Tradingview link: https://www.tradingview.com/chart/USDRON/FwhFtDd9-USDRON-Short-Signal/
-
USDTRY Sell Signal
- April 25, 2019
- Posted by: Tradingshot Articles
- Category: Uncategorized
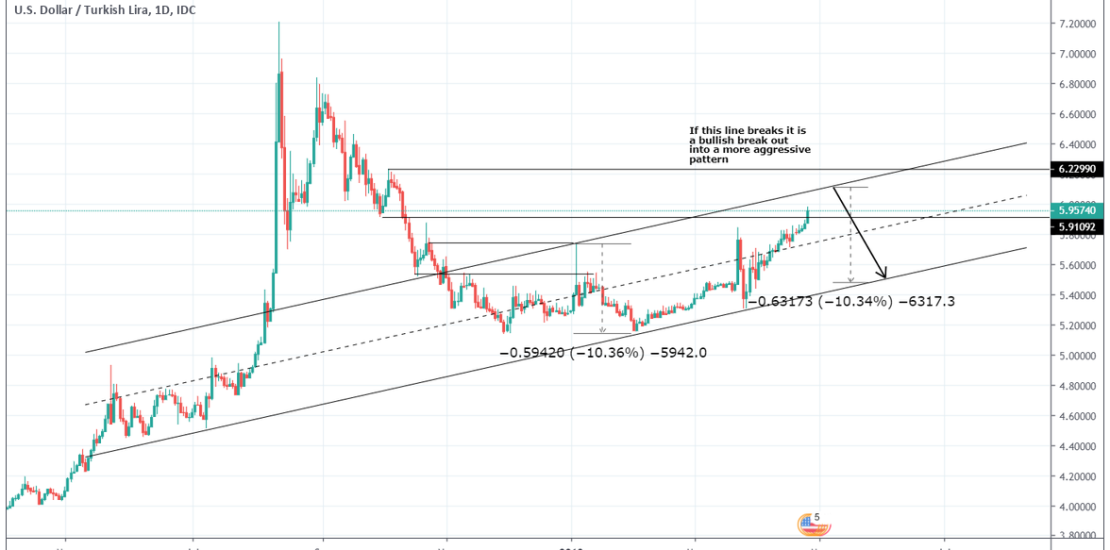
Pattern: 1W Channel Up. Signal: Bearish once the price makes a Higher High. Target: Around -10% from where the Higher High is made. *If 6.22990 breaks, close and wait for a new (quite possibly more aggressive) bullish pattern to trade. Tradingview link: https://www.tradingview.com/chart/USDTRY/73rhZrvk-USDTRY-Sell-Signal/
-
EURCHF Sell Signal
- April 25, 2019
- Posted by: Tradingshot Articles
- Category: Uncategorized
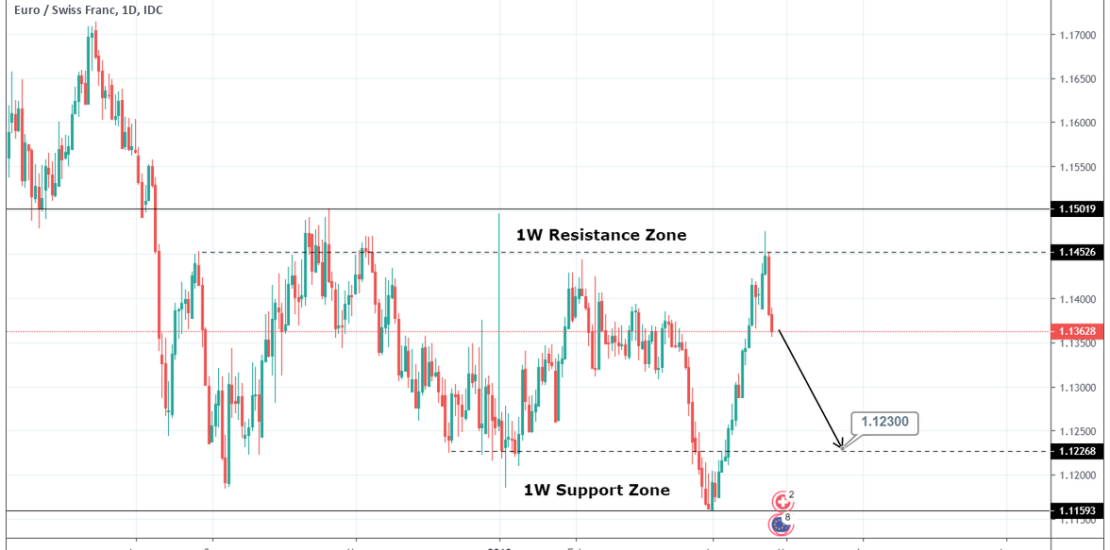
Pattern: Rectangle on 1W. Signal: Bearish after the price was rejected on the 1W Resistance Zone. Target: 1.12300 (just above the 1W Support Zone). Tradingview link: https://www.tradingview.com/chart/EURCHF/cxiTKzTp-EURCHF-Sell-Signal/
-
Gold’s most important long term test is here! Don’t ignore it!
- April 18, 2019
- Posted by: Tradingshot Articles
- Category: Uncategorized
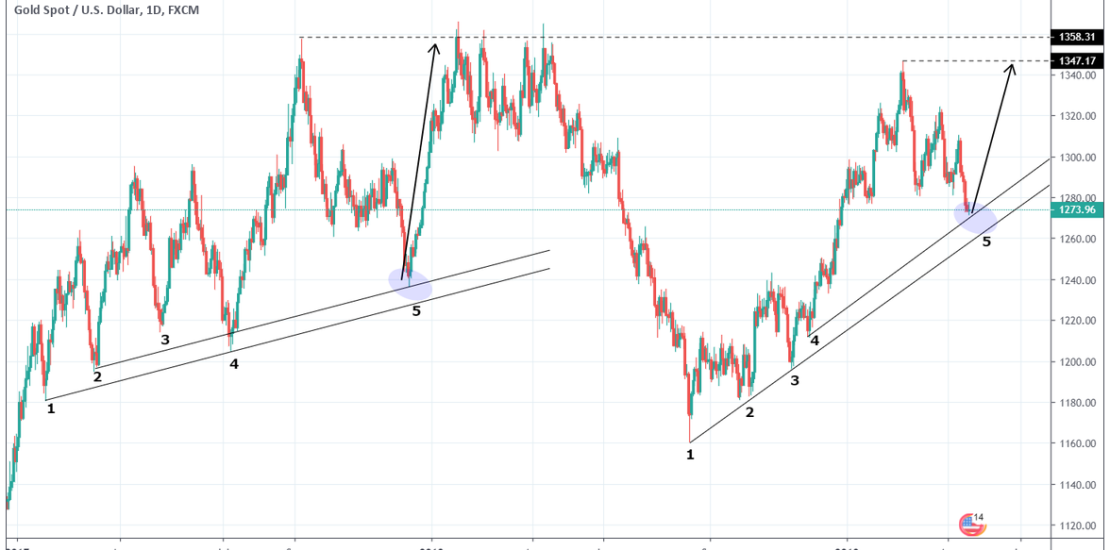
Gold has been declining since mid February and the 1,346.79 High. If this pull back has been purely technical then the important test on the 1W chart has arrived as the price is on the Higher Low region. What is more interesting is that last time Gold tested a weekly Higher Low on a similar