

- April 30, 2019
- Posted by: Tradingshot Articles
- Category: Uncategorized
Due to the price difference on exchanges, a lot of the attention lately is being drawn away from what matters most. Is the worst over for BTC? Has the new bull cycle started?
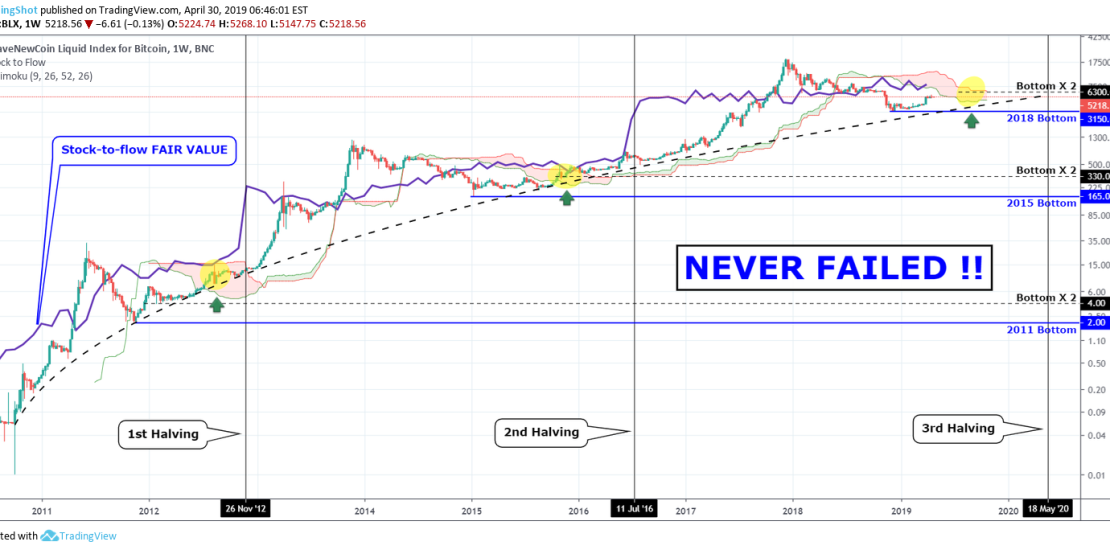
With this as motive, I thought it would be productive to accumulate the strongest long term bullish indicators on Bitcoin. And I have come up with a combination that has never failed on its historic price action!
** The Blue Price Line is the Stock-to-Flow indicator that represents Bitcoin’s Fair Value. Before each Halving this touches the actual candle sequence and then aggressively gaps upwards just a few weeks before the Halvings. What follows is (essentially the start of the new bull market) a logarithmic rise on the actual value which as some point breaks the Fair Value and becomes overbought towards the bull cycle’s peak (and new ATH).
** Once the price breaks inside the Ichimoku Cloud, it never looks back and each Low is higher. In the previous 2 bull cycles, every time the price broke inside the Ichimoku Cloud, it touched the Stock-to-flow price line. After that test, the price managed to break above the Ichimoku Cloud, but the Stock-to-flow price line worked as a Resistance (until roughly a couple of months before the peak).
** Every time the price is doubled from the Bottom it makes on the parabolic curve (Bottom X 2), it never makes a new low. This is perhaps the strongest bullish indicator on Bitcoin’s historic volatility.
The combination of the above criteria is projected to take place within July – October 2019. Until then it is best to keep accumulating.
Do you agree with these indicators? Do you have a better long term buy signal? I welcome every argument on the comments section!!
As usual take a look at some related material on BTC:


