

- May 13, 2019
- Posted by: Tradingshot Articles
- Category: Uncategorized
The title says everything. I don’t want to get into much detail. Just want to point out the similarities and differences of the two time periods when Bitcoin broke the 1W MA100 after the market made a bottom. Note that it is not necessary to follow the exact same pattern as the fundamentals this time are very strong.
Similarities:
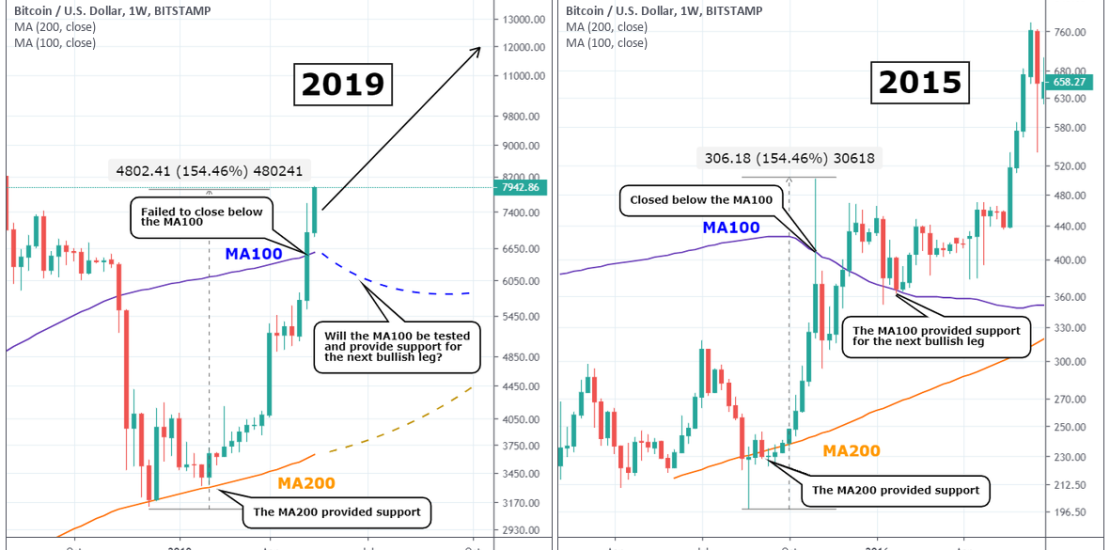
* The rise in 2015 stopped at +145.50% before pulling back. Currently (2019) we are also at +145.50% from the December (and cycle low).
* The MA200 provided support to this strong rise on both occasions.
Differences:
* In 2015 the 1W candle that crossed above the MA100 managed to close below it. Last week’s candle failed to close below the MA100.
* In 2015 the following 1W candle after the MA100 break, was bearish and pulled back. The current weekly candle isn’t.
It remains to be seen if the MA100 will later provide the support, as it did in 2015, necessary to create the bullish conditions for the next strong bullish sequence. After that test in 2015 BTC never touched the MA100 again until later deep into the bear market and the November 2018 final flush.
So what do you think? Will we test the MA100 again or we’ll see it again on the next bear market? Share your thoughts in the comments section!
See a possible scenario on symmetric probabilities if Bitcoin starts ‘attaching’ the previous Resistance levels:
