

- October 27, 2019
- Posted by: Tradingshot Articles
- Category: Cryptocurrency
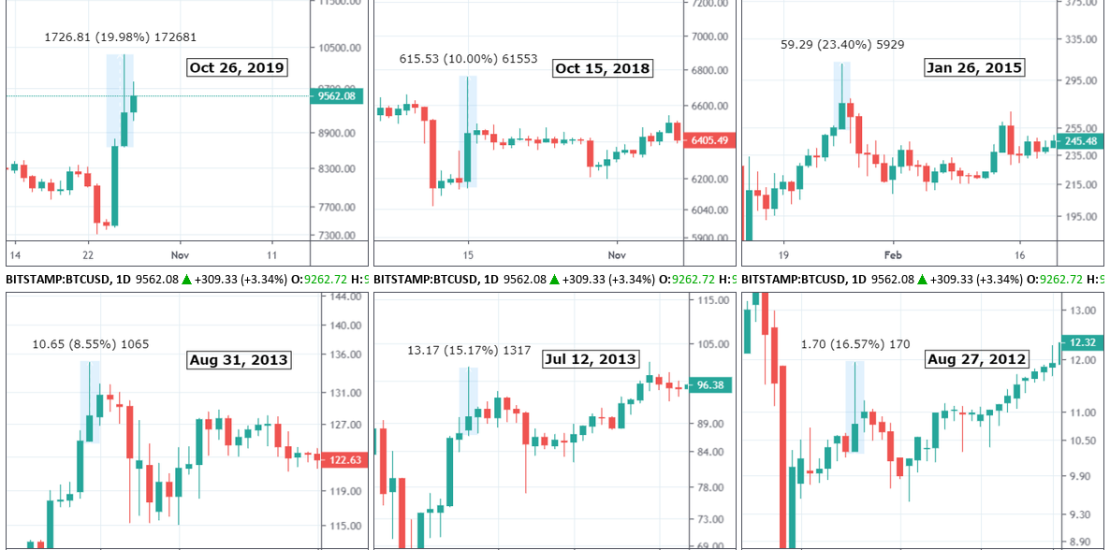
Since 2012 I managed to find another 5 occasions of such occurrence (50% pull back on closing). All of them delivered a sharp fall almost right after that candle with the exception of October 15, 2018 when the drop took 13 days to happen.
It needs to be mentioned that based purely on the candle shape, the more similar sequence with the current action is the August 31, 2013. Even though it was an extension of a bullish sequence, the one candle before and after is fairly identical.
How the current price action will unfold is hard to say with safety but one thing is certain. Human psychology is quite similar under specific conditions and this is why trading patterns are repeated over and over again. The -50% closing from the top on the candle that is being reviewed is indication of heavy profit taking and/ or strong Resistance presence (until it is broken). The same kind of investor behavior we see on the other 5 occasions which occurred in completely different time periods.
Do you think BTC will repeat a sharp decline after this immense 3 day rise as it happened in the past? Or it is the start of a new much stronger bull run? Let me know in the comments section!
Please like, subscribe and share your ideas and charts with the community!