

- October 21, 2019
- Posted by: Tradingshot Articles
- Category: Cryptocurrency
Following the latest analysis on Bitcoin’s Symmetrical Cycles (2017/18 vs 2019) on the 1M chart (you can find it at the bottom of this study), I have decided to take the research one step further and attempt to time the bottom of the current correction.
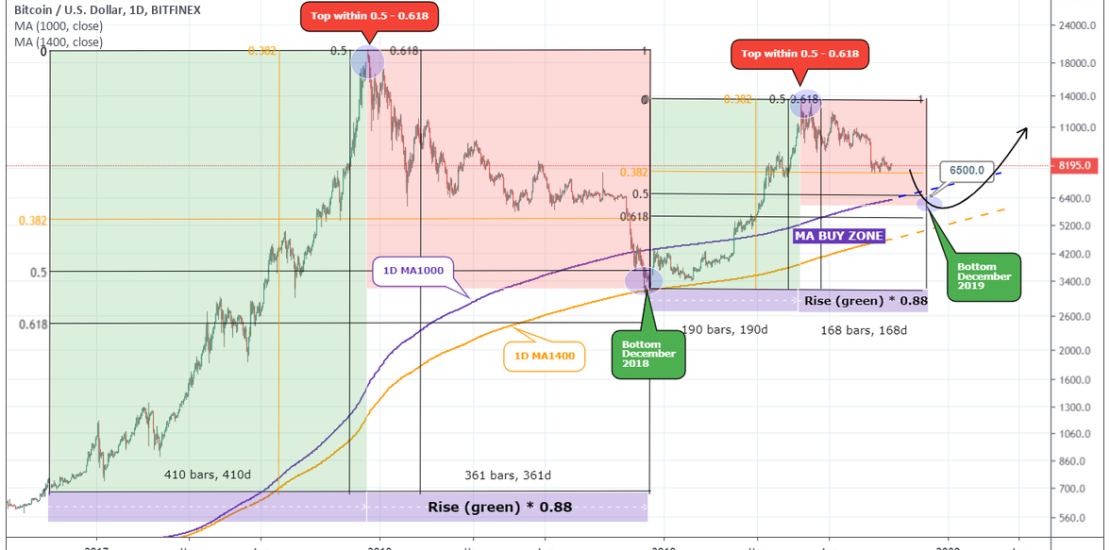
In doing so I have scaled down to the 1D chart using again the MA1000 and MA1400 periods as the long term Buy Zone to give us again a perspective of where buy accumulation is on its optimal level.
* Symmetrical Cycles
Then I have kept the previous study’s phases:
* On one hand the 2017 final aggressive 13 month rise of only 3 red months and the 2018 symmetrical 13 month Bear Cycle of only 3 green months.
* On the other the 2019 very aggressive (parabolic) sequence of 5 straight green months and the current correction (of at the moment 3 straight red months).
But having applied them on the 1D chart, I had to do a few (minor) modifications regarding the duration of the cycles in order to fit the exact Tops and Bottoms on the daily frame. This doesn’t alter the efficiency of the projection. The key characteristic is that the Bear phase is 0.88*Bull phase. This puts the end of the current correction (bottom) in early December 2019.
*The Fibonacci Boxes
What is more important on the current study is the application of the Fibonacci retracement levels (log scale) on both axis (price and time) creating a box. Each box fits inside the Bull and Bear phases of each Cycle. As you see the Top on both Cycles was made within the 0.5 and 0.618 Fibonacci extension. The bottom in 2018 was made within the 0.5 – 0.618 Fibonacci retracement level. Similarly I find no reason not to assume that the current bottom will be outside the 0.5 – 0.618 level, which is within 6500 – 5500.
*The Scary Coincidence
All the above factors combined place the expected bottom within $6500 – 5500, comfortably on the MA1000/1400 Buy Zone in December 2019. Coincidentally the 2018 Bottom (and Bear Cycle low) was also made in December. So practically we have 2 identical cycles (both Bull and Bear) with symmetrical tops and same candle characteristics on the monthly chart (mentioned on the previous analysis) that can potentially bottom on the same month.
Is this scary enough for you? Too obvious of a pattern/ projection to be fulfilled? Well in my opinion this is a fair estimation of when we should start preparing for a bull party again! You are all invited to like, subscribe and share your comments, ideas and charts with me!
See the previous study on the 1M (monthly) chart below

As well as complementary material on the expected bottom


