

-
DOW JONES broke above the 1D MA50. Buy Signal.
- October 4, 2020
- Posted by: Tradingshot Articles
- Category: Stock Indices
No Comments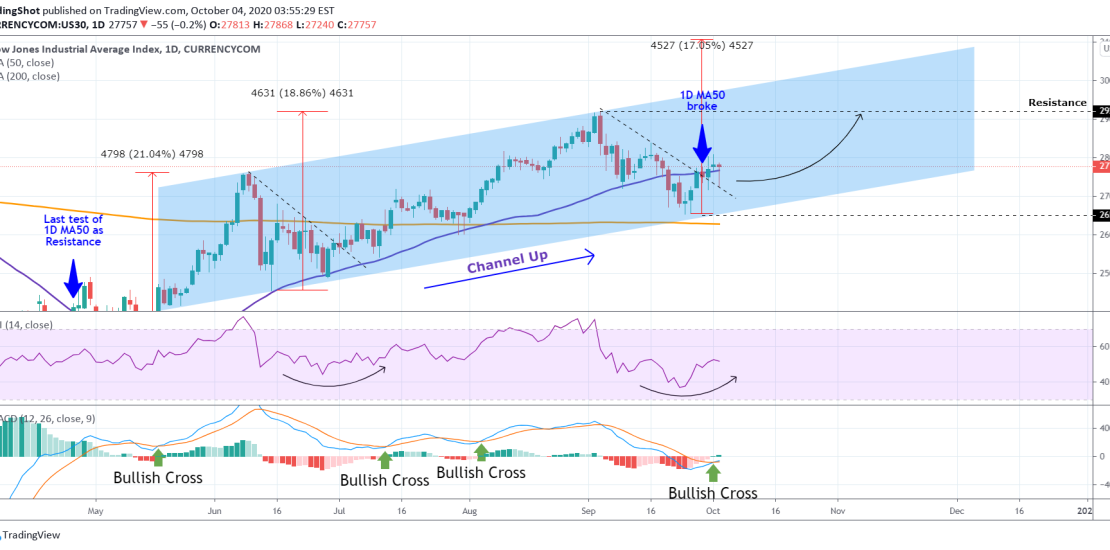
Pattern: Channel Up on 1D. Signal: Buy as the price broke above the 1D MA50, crossing it as a Resistance for the first time since April 27. Also the MACD formed a Bullish Cross. The past 3 occurrences initiated a rally. Target: 29200 (the Resistance). ** Please support this idea with your likes and
-
S&P500 Rebound on the 4H MA50
- October 3, 2020
- Posted by: Tradingshot Articles
- Category: Stock Indices
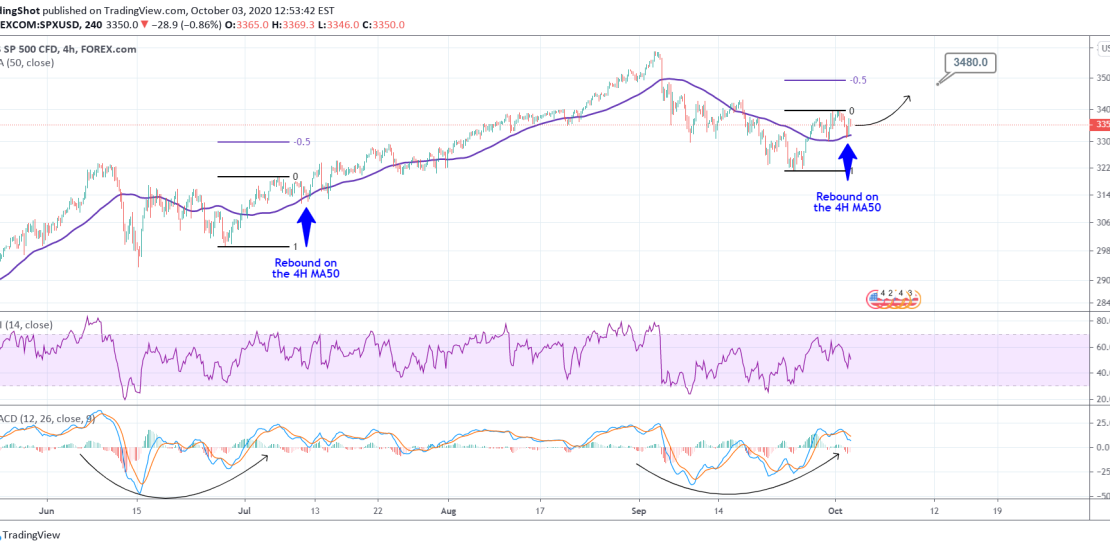
Pattern: 4H MA50 rebound. Signal: Buy as last time the 4H MA50 was tested and held as Support, a 2 month rally started. RSI and MACD are similar to that fractal of early July. Target: 3480 (the -0.5 Fib extension). Most recent S&P signal: ** Please support this idea with your likes and comments,
-
S&P500 Buy Signal (long-term)
- September 22, 2020
- Posted by: Tradingshot Articles
- Category: Stock Indices
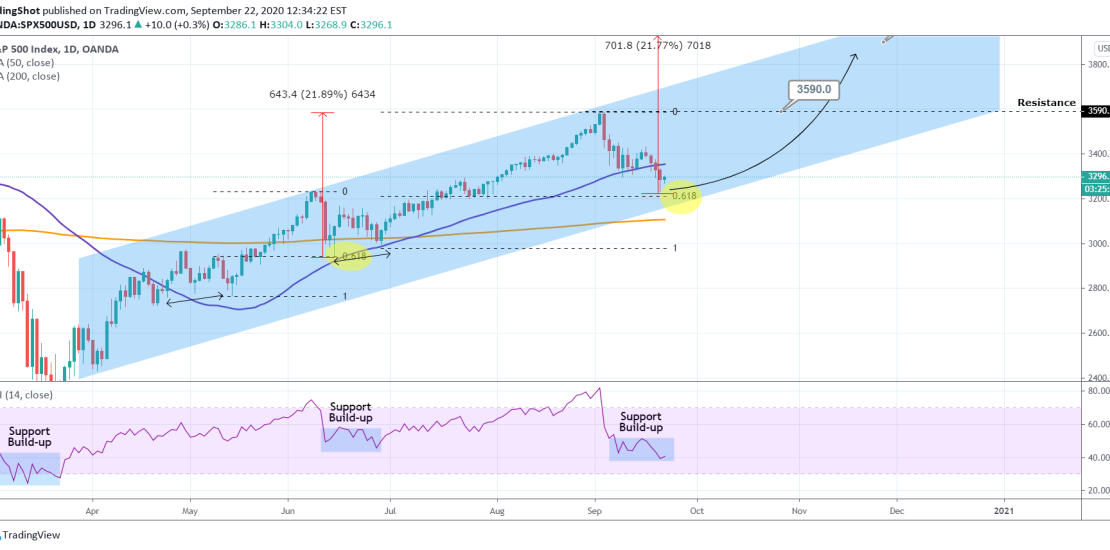
Pattern: Channel Up on 1D. Signal: Buy as the price reached the 0.618 Fibonacci retracement level from its previous bottom. Target: 3590 medium-term (Resistance) and for long-term traders 3900 (+21.90% rise from this bottom). ** Please support this idea with your likes and comments, it is the best way to keep it relevant and
-
S&P500 Sell Signal
- June 23, 2020
- Posted by: Tradingshot Articles
- Category: Stock Indices
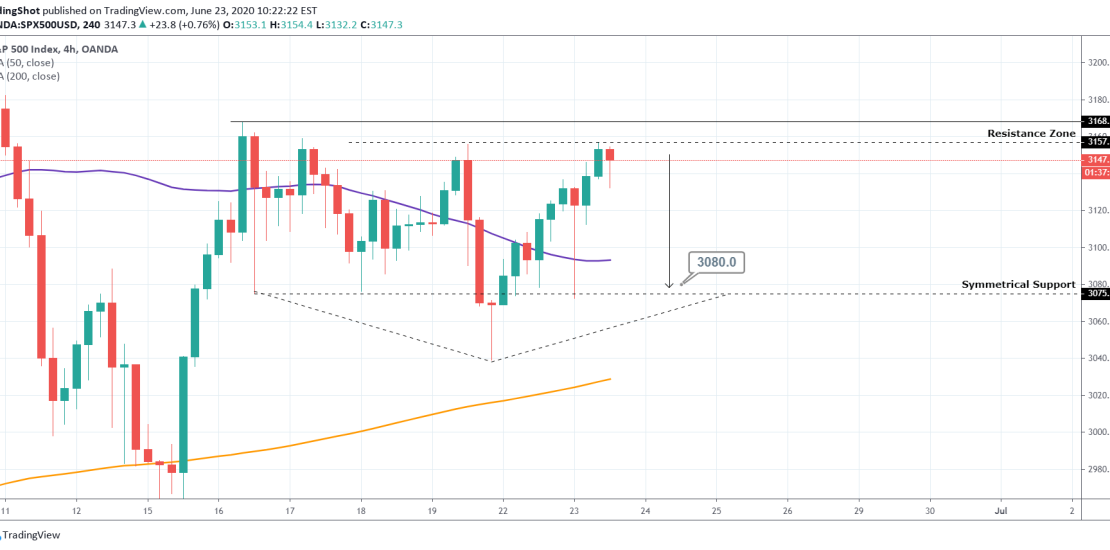
Pattern: Resistance/ Support trading. Signal: Bearish as the price is testing the Resistance Zone. Target: 3080 (just above the Symmetrical Support). ** Please support this idea with your likes and comments, it is the best way to keep it relevant and support me. ** Most recent S&P signal: Tradingview link: https://www.tradingview.com/chart/SPX500USD/nhkSckBi-S-P500-Sell-Signal
-
S&P500 Sell Signal
- June 16, 2020
- Posted by: Tradingshot Articles
- Category: Stock Indices
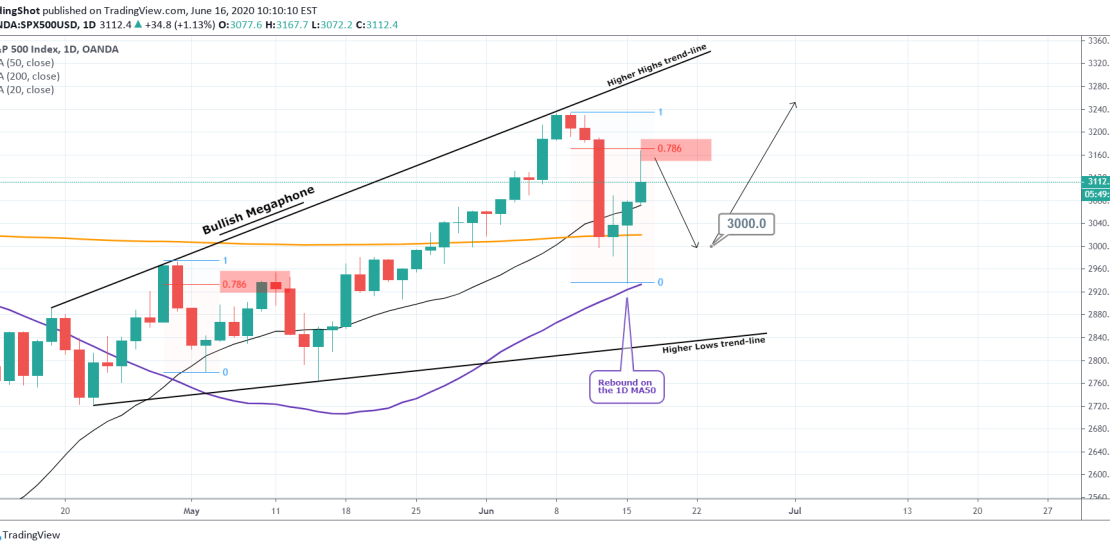
Pattern: Bullish Megaphone Signal: Bearish as it was rejected on the 0.786 Fibonacci. Target: 3000. ** Please support this idea with your likes and comments, it is the best way to keep it relevant and support me. ** Tradingview link: https://www.tradingview.com/chart/SPX500USD/R6dzhsBi-S-P500-Sell-Signal
-
S&P500 Is COVID just a bounce inside the Channel?
- April 23, 2020
- Posted by: Tradingshot Articles
- Category: Stock Indices
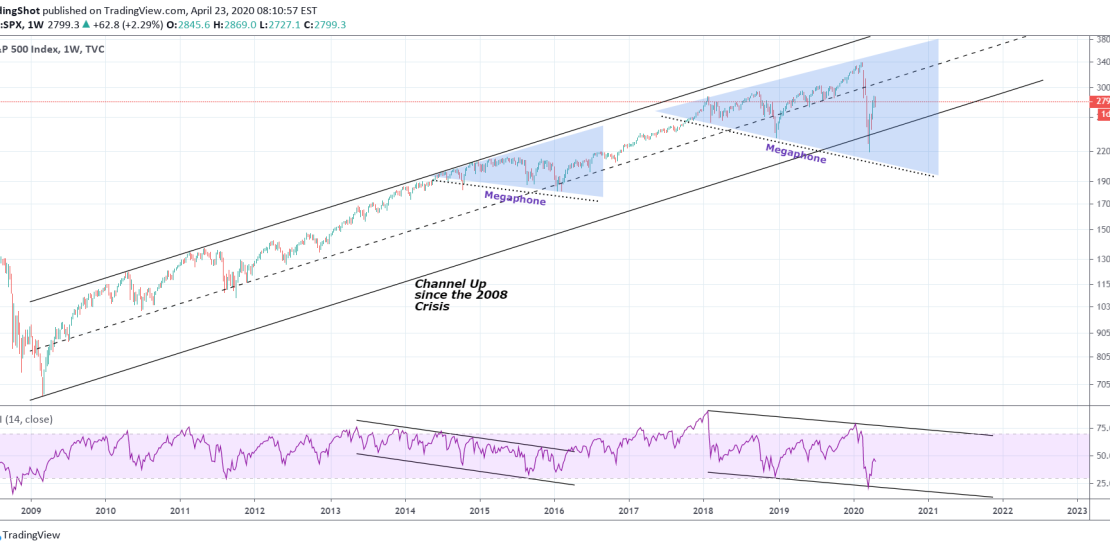
* Please support this idea with your likes and comments, it is the best way to keep it relevant and support me. ** Well as you see the chart is pretty explanatory. I want your thoughts on a simple question. Was the sell-off driven by the COVID pandemic just a necessary technical bounce inside the
-
S&P500 Trading Plan
- April 1, 2020
- Posted by: Tradingshot Articles
- Category: Stock Indices
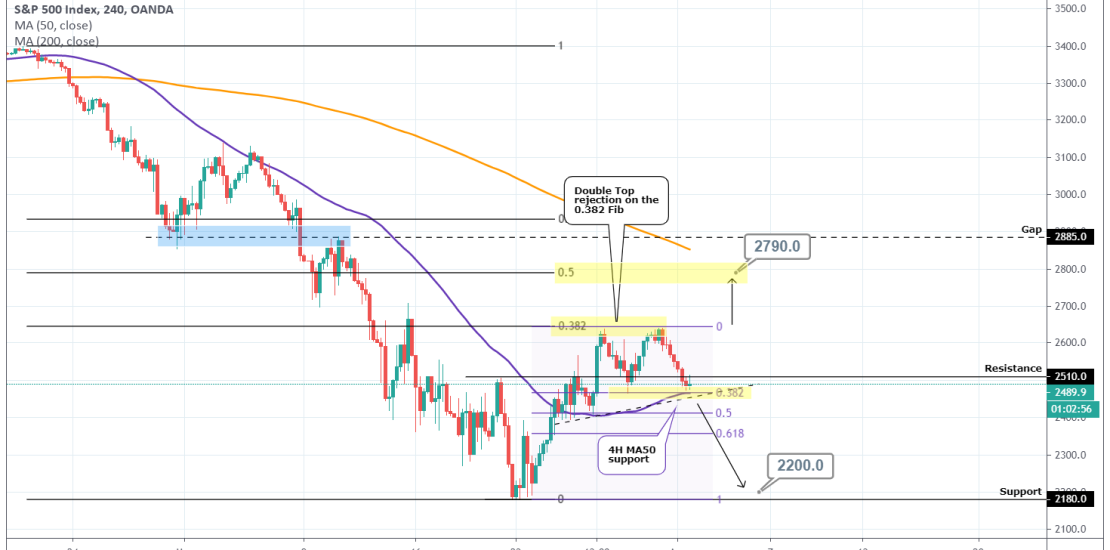
Pattern: Fibonacci retracement on the 0.382 level. Signal: (A) Bearish if the 4H MA50 is crossed, (B) Bullish if the 2650 Resistance breaks. Target: (A) 2200 (just above the 2180 Support), (B) 2790 (0.5 Fibonacci and MA200 contact). Tradingview link: https://www.tradingview.com/chart/SPX500USD/nGh4d23w-S-P500-Trading-Plan
-
DAX Sell Signal
- January 23, 2020
- Posted by: Tradingshot Articles
- Category: Stock Indices
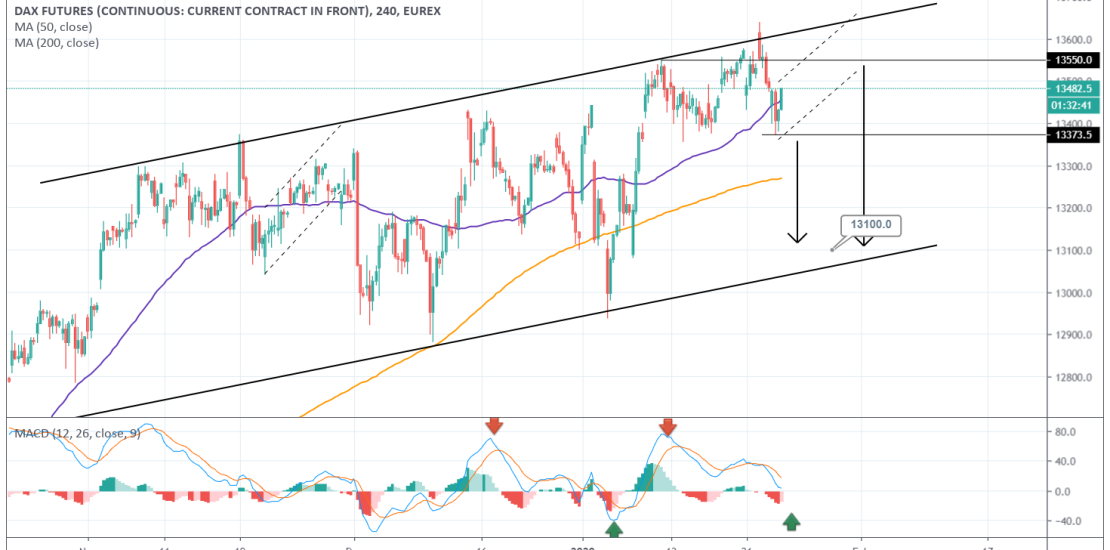
Pattern: Channel Up on 1D. Signal: Bearish either if the price breaks 13373.50 or hits 13550 again. Target: 13100. Tradingview link: https://www.tradingview.com/chart/FDAX1!/ZBHqpAUj-DAX-Sell-Signal
-
DAX Sell Signal
- January 23, 2020
- Posted by: Tradingshot Articles
- Category: Stock Indices

Pattern: Channel Up on 1D. Signal: Bearish either if the price breaks 13373.50 or hits 13550 again. Target: 13100. Tradingview link: https://www.tradingview.com/chart/FDAX1!/ZBHqpAUj-DAX-Sell-Signal
-
HANG SENG Buy Signal
- November 13, 2019
- Posted by: Tradingshot Articles
- Category: Stock Indices
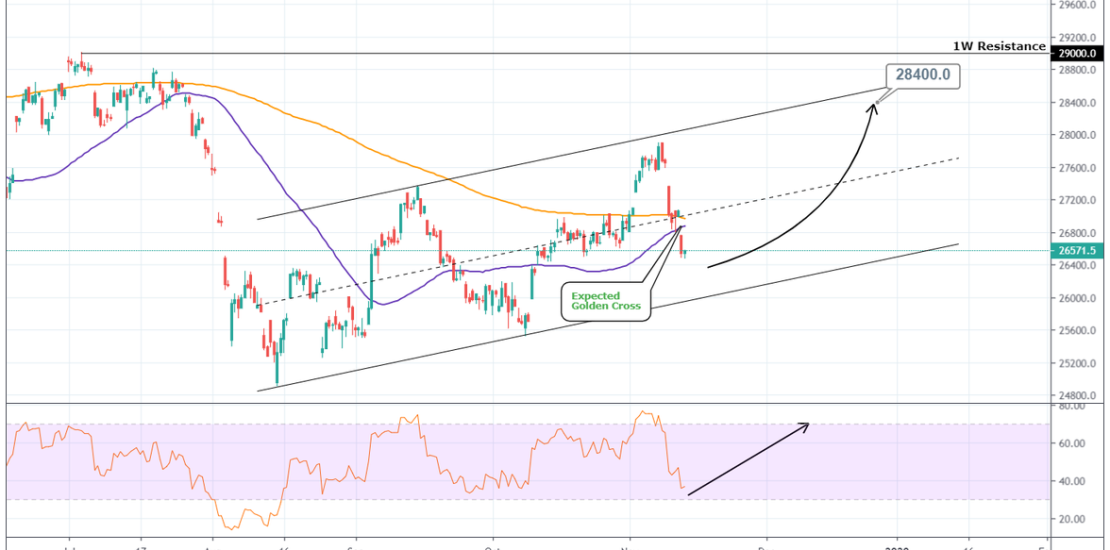
Pattern: Channel Up on 1D. Signal: Bullish as the pattern is approaching its Higher Low and the 4H RSI is on support levels. Target: 28400 (below the 1W Resistance). Tradingview link: https://www.tradingview.com/chart/HSI/TOol9A5F-HANG-SENG-Buy-Signal