

-
What’s the top for Litecoin? 113 or 180? Is it worth waiting?
- April 6, 2019
- Posted by: Tradingshot Articles
- Category: Uncategorized
No Comments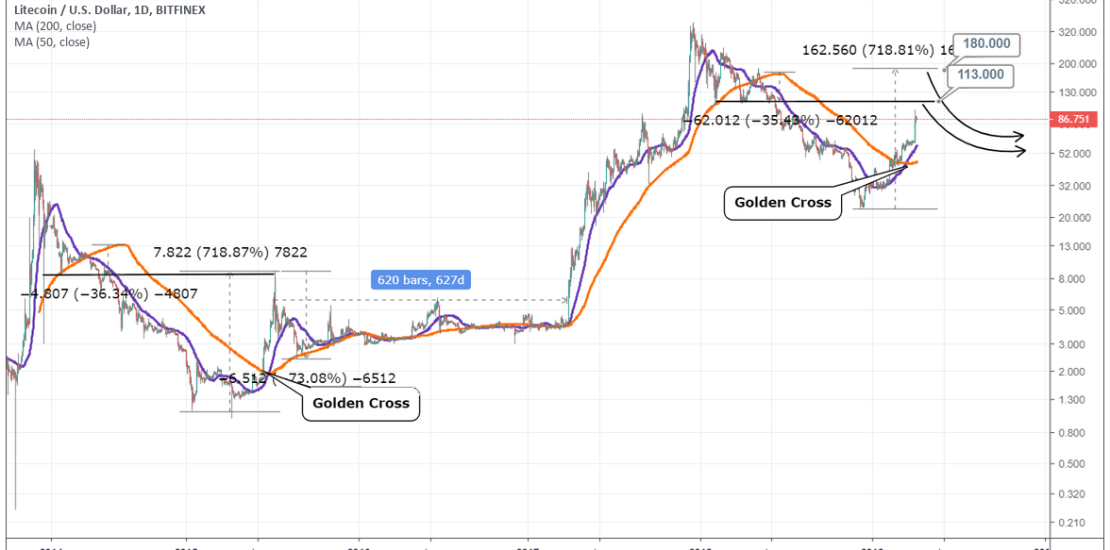
Litecoin has continued its crazy rise since the December 2018 bottom and only recently made the Golden Cross (MA200/50) which paved the way for last week’s $98 Top. You can’t say I didn’t warn you about this super aggressive rise in February when LTC was trading at $49 as seen below: Now, almost 100% higher
-
ETHUSD On the verge of a bullish break-out
- April 2, 2019
- Posted by: Tradingshot Articles
- Category: Uncategorized
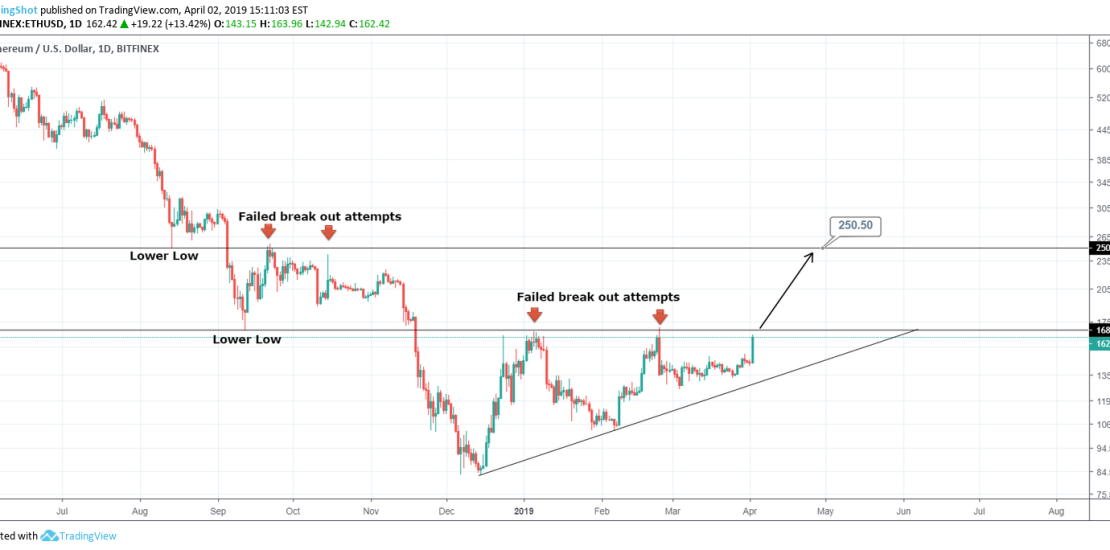
Ethereum is close to a 3rd test of the 168.50 1D Resistance. If it is crossed, then the 1D Triangle is broken and the price should target the next 1W Resistance at 250.50. Buy on the break out. My long term outlook: Tradingview link: https://www.tradingview.com/chart/ETHUSD/Muifcnkf-ETHUSD-On-the-verge-of-a-bullish-break-out/
-
COPPER Buy Signal (Support)
- March 26, 2019
- Posted by: Tradingshot Articles
- Category: Uncategorized
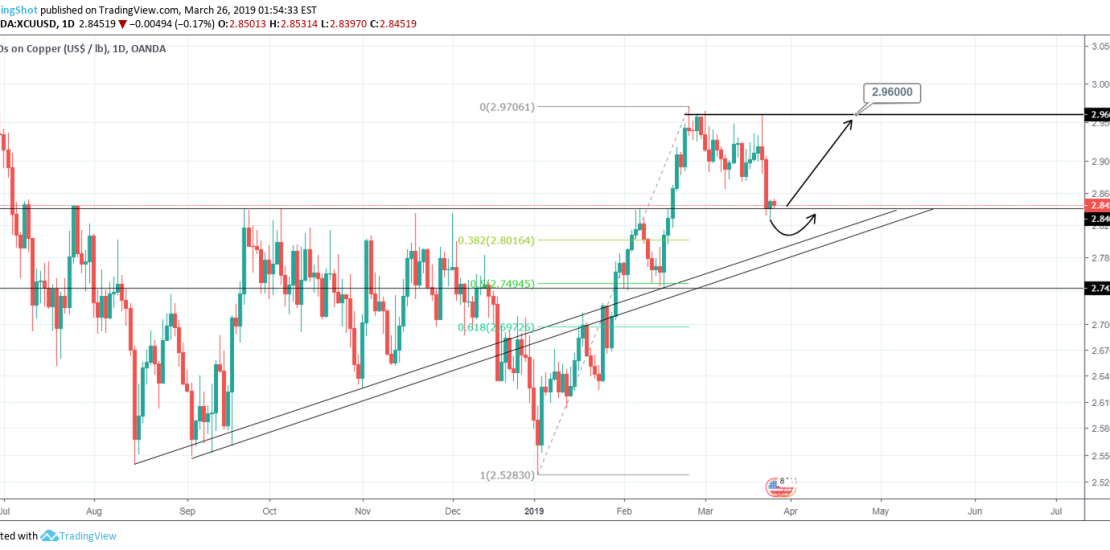
Pattern: Fibonacci retracement. Signal: Bullish either now (1D support) or on the 0.382 Fibonacci. Target: 2.96000. Tradingview link: https://www.tradingview.com/chart/XCUUSD/qFkZ8SeG-COPPER-Buy-Signal-Support/
-
GBPUSD Sell Signal
- March 25, 2019
- Posted by: Tradingshot Articles
- Category: Uncategorized
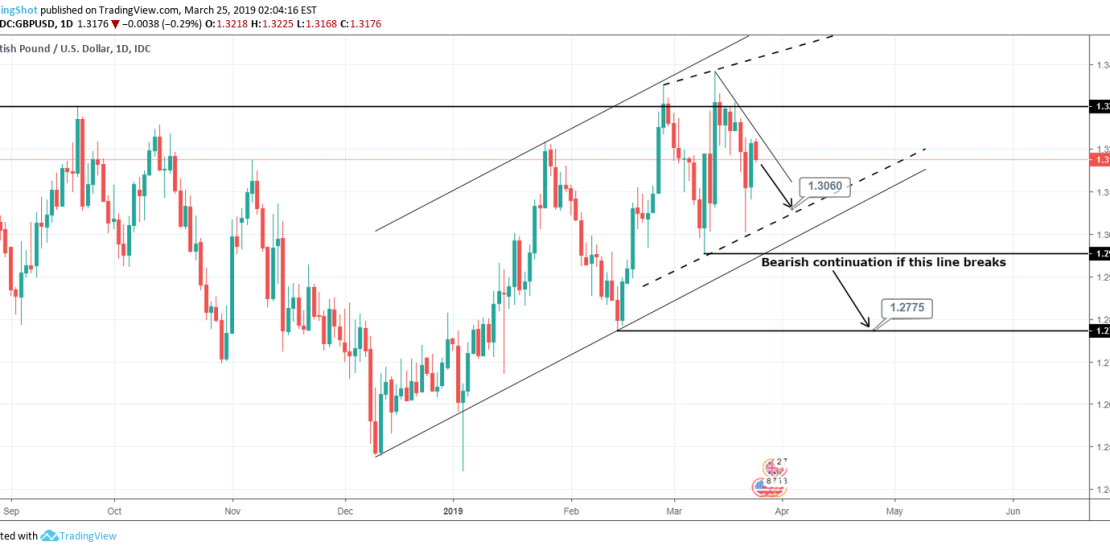
Pattern: Channel Up on 1D. Signal: Bearish as 4H is on Lower Highs creating a Triangle. Target: 1.3060 (Higher Low). * If 1.2955 breaks it is a bearish break out from the 1D Channel Up. TP 1.2775. Tradingview link: https://www.tradingview.com/chart/GBPUSD/BuluaKKT-GBPUSD-Sell-Signal/
-
HUOBI TOKEN +70% Upside potential
- March 24, 2019
- Posted by: Tradingshot Articles
- Category: Uncategorized
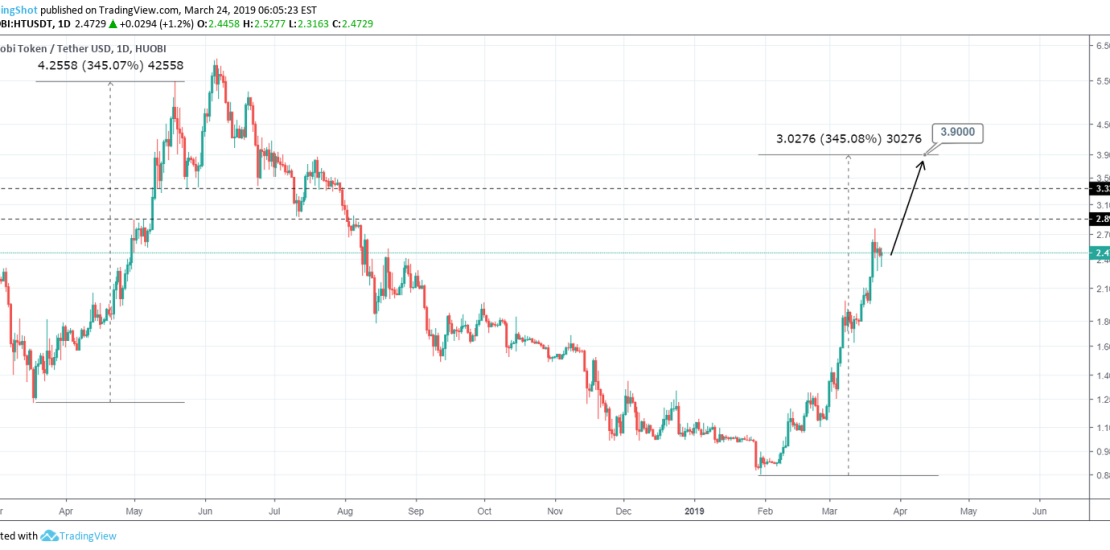
Pattern: Parabolic bullish curve on 1D. Signal: Bullish on every pull back. Target: 3.9000 (+345% from bottom similar to the previous bullish parabola). Tradingview link: https://www.tradingview.com/chart/HTUSDT/2aMDbMah-HUOBI-TOKEN-70-Upside-potential/
-
XTZUSD +80% profit opportunity on Buy Signal
- March 24, 2019
- Posted by: Tradingshot Articles
- Category: Uncategorized
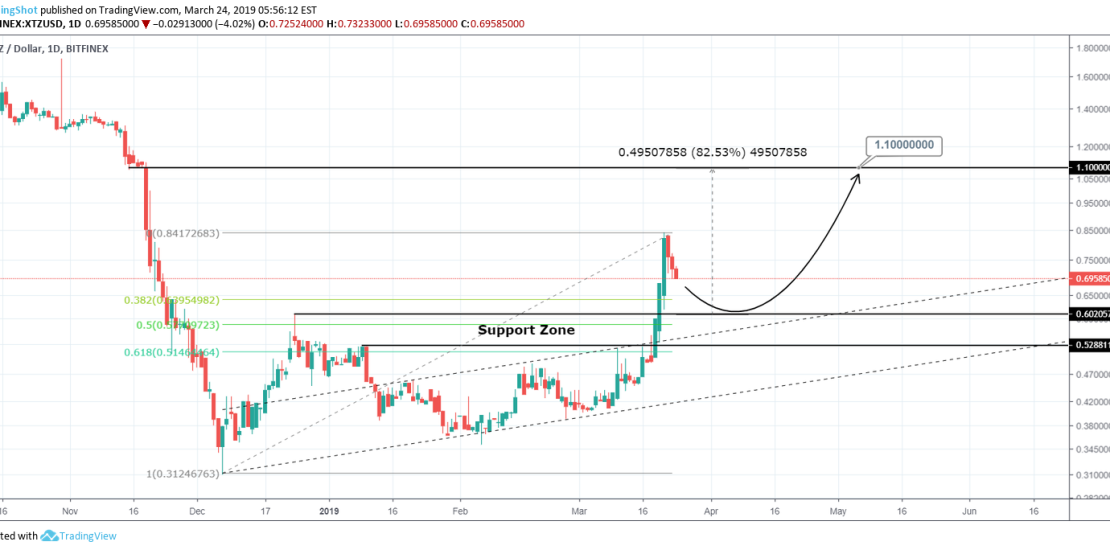
Pattern: 0.382 – 0.618 Fibonacci retrace on 1D. Signal: Bullish once the price tests the Support Zone. Target: 1.1000 (Gap fill on 1D). Tradingview link: https://www.tradingview.com/chart/XTZUSD/EEed19iC-XTZUSD-80-profit-opportunity-on-Buy-Signal/
-
EURUSD The big picture
- March 22, 2019
- Posted by: Tradingshot Articles
- Category: Uncategorized
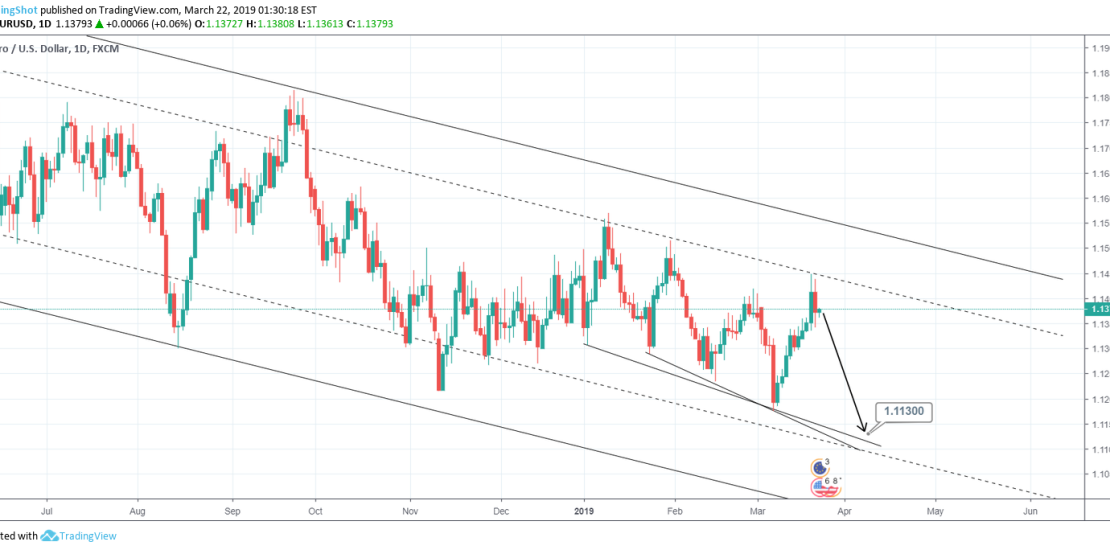
Pattern: Channel Down on 1W. Signal: Bearish after a Lower High was made. Target: 1.1130. My previous trades on this pattern: Tradingview link: https://www.tradingview.com/chart/EURUSD/u7QuzQqq-EURUSD-The-big-picture/
-
BITCOIN The parabolic bull run’s support
- March 20, 2019
- Posted by: Tradingshot Articles
- Category: Cryptocurrency
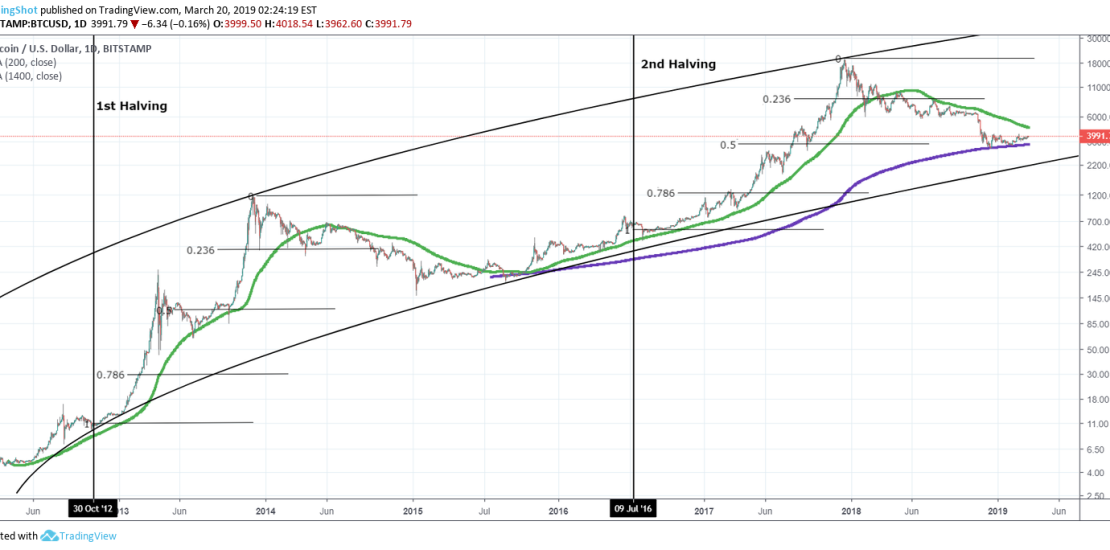
As BTC gets closer to the essential MA200 test supported by the MA1400 on 1D, I have come across a new support level level, which has been missing from key analyses out there. It is known that the Halvings historically signal the start of the new bull market on Bitcoin that escalates into a parabolic
-
BTCUSD Where symmetry meets the resistance
- March 19, 2019
- Posted by: Tradingshot Articles
- Category: Uncategorized
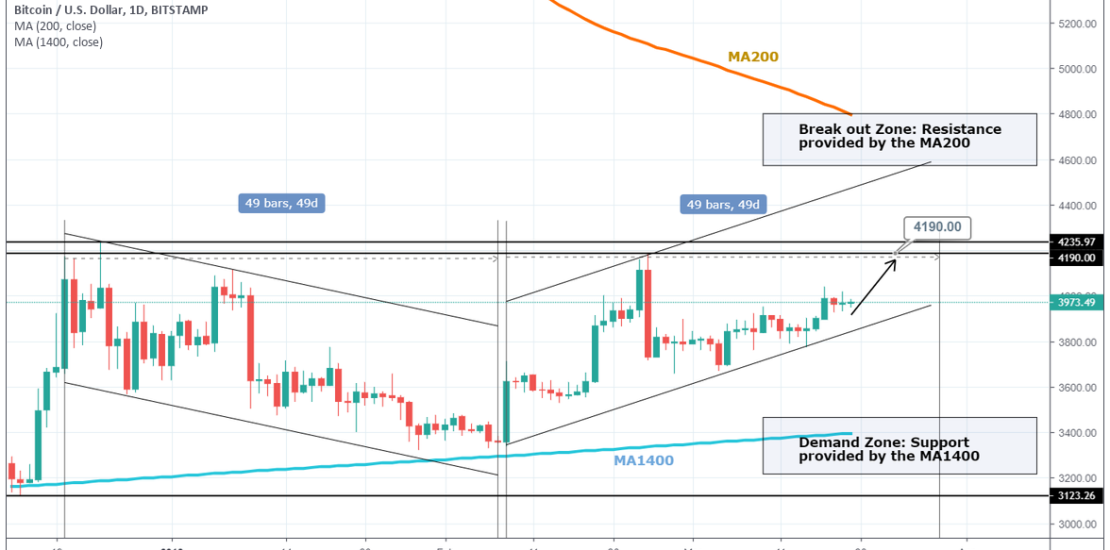
The symmetrical 1D Channel Up is close to hitting the 4190 target but more significantly to meet the MA200 that has been holding the bear market in place. This is a very important benchmark for Bitcoin as any break above this level technically signals the end of the bear market. High significance 2 – 3
-
GBPUSD Sell Signal
- March 18, 2019
- Posted by: Tradingshot Articles
- Category: Uncategorized
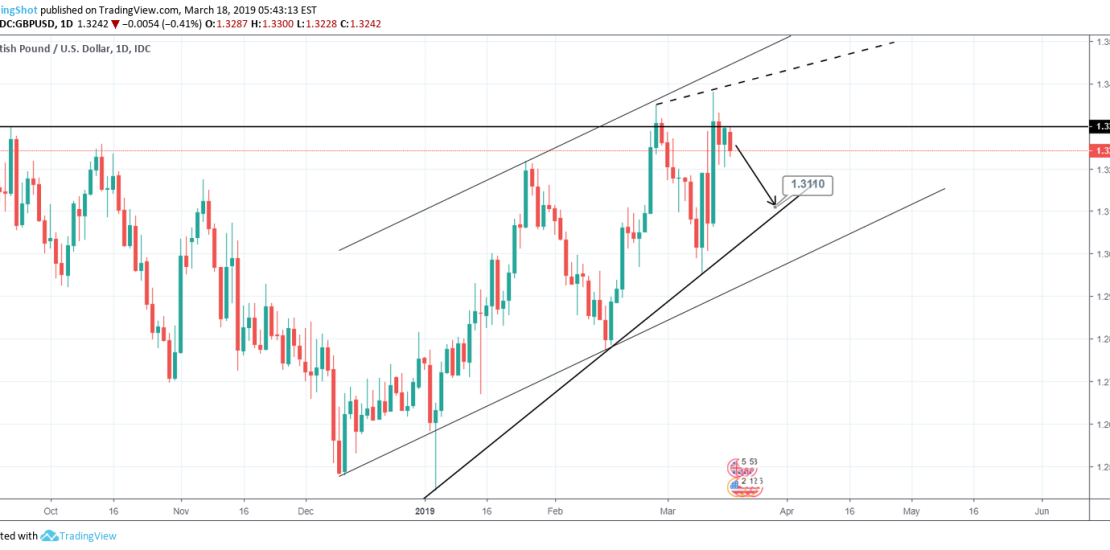
Pattern: 1D Channel Up. Signal: Bearish after the pattern made a Higher High. Target: 1.3110 (the inside supporting trend line of the Channel Up). The long term Brexit effect on GBPUSD: Tradingview link: https://www.tradingview.com/chart/GBPUSD/FnaNXcbZ-GBPUSD-Sell-Signal/