

-
BITCOIN 10k broken! This buy wave isn’t over according to Gold!!
- June 22, 2019
- Posted by: Tradingshot Articles
- Category: Cryptocurrency
No Comments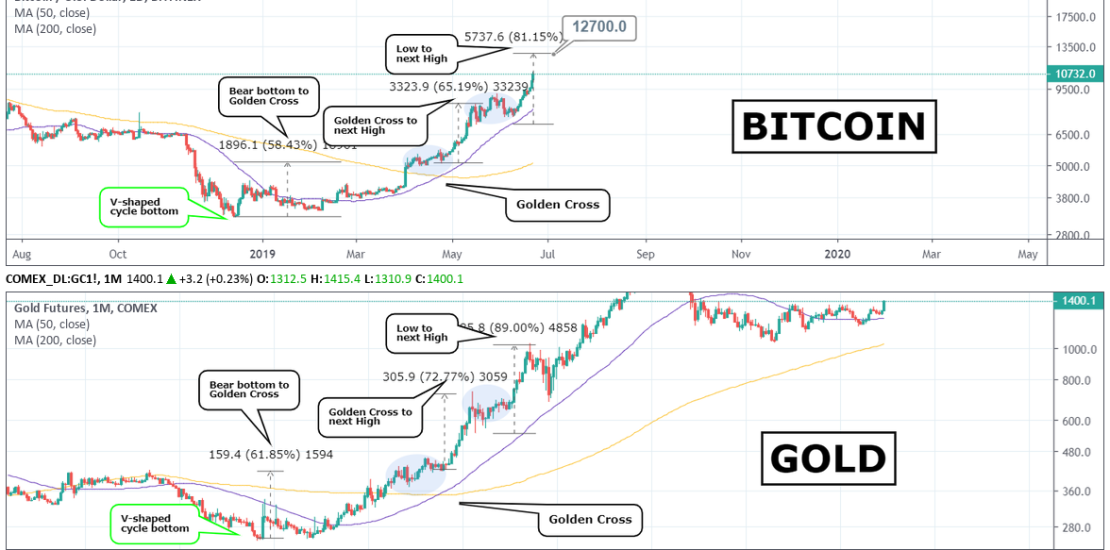
The Bitcoin – Gold road-map (the Golden standard as many call it) holds firm! Their parallel course continues but traders continue to turn their back on it. Why ignore the BTC-Gold comparison when it has been 100% accurate so far? First it predicted the market bottom and the subsequent early buy signal based on it
-
DAX Long term Buy Signal
- June 20, 2019
- Posted by: Tradingshot Articles
- Category: Uncategorized
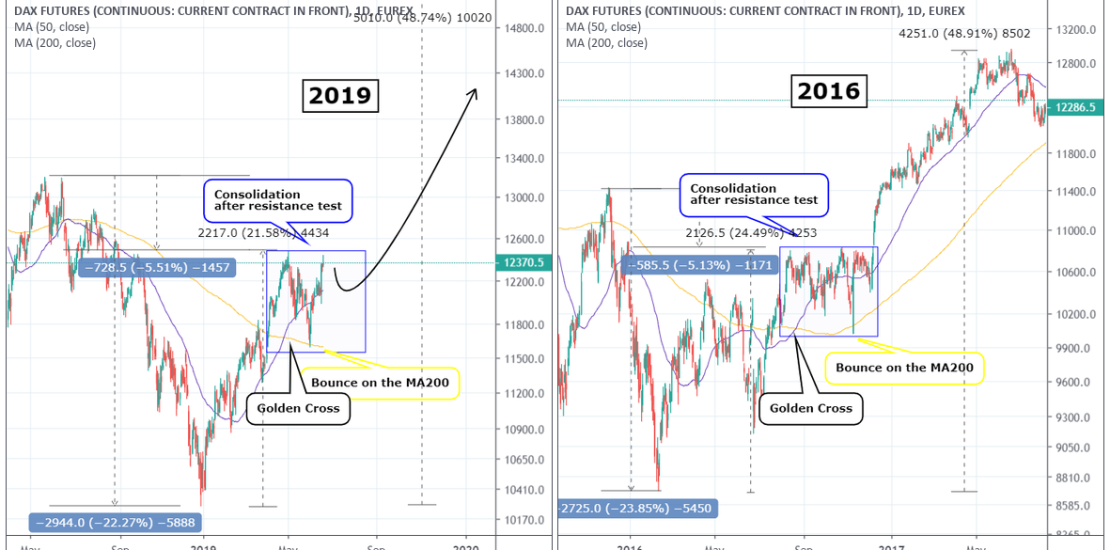
Pattern: Golden Cross on 1D. Signal: Bullish as the price action is following the 2016 pattern. Same bounce on the MA200. Target: Depends on your trading horizon. 13200 ATH with 14000 as an extension are fair targets. Tradingview link: https://www.tradingview.com/chart/FDAX1!/3bBW2mM6-DAX-Long-term-Buy-Signal
-
LINKUSD Buy Signal
- June 19, 2019
- Posted by: Tradingshot Articles
- Category: Uncategorized
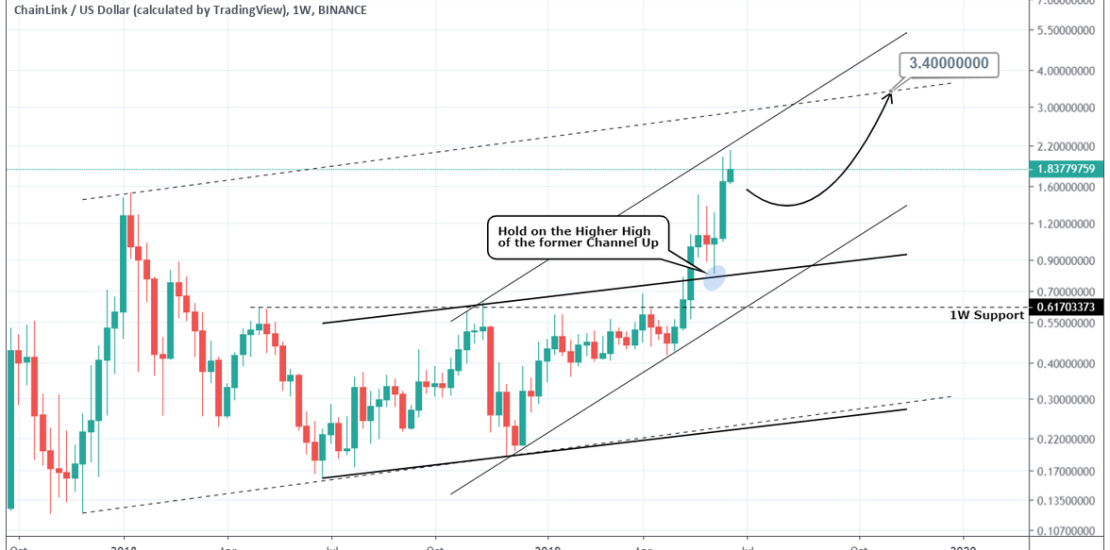
Pattern: Channel Up on 1W. Signal: Bullish as the price made a strong hold on the former Channel Up (bold lines). Target: 3.40000 (meet with the ATH trend line (dashed)). Tradingview link: https://www.tradingview.com/chart/LINKUSD/SKChReuQ-LINKUSD-Buy-Signal
-
WTI OIL Buy Signal
- June 3, 2019
- Posted by: Tradingshot Articles
- Category: Uncategorized
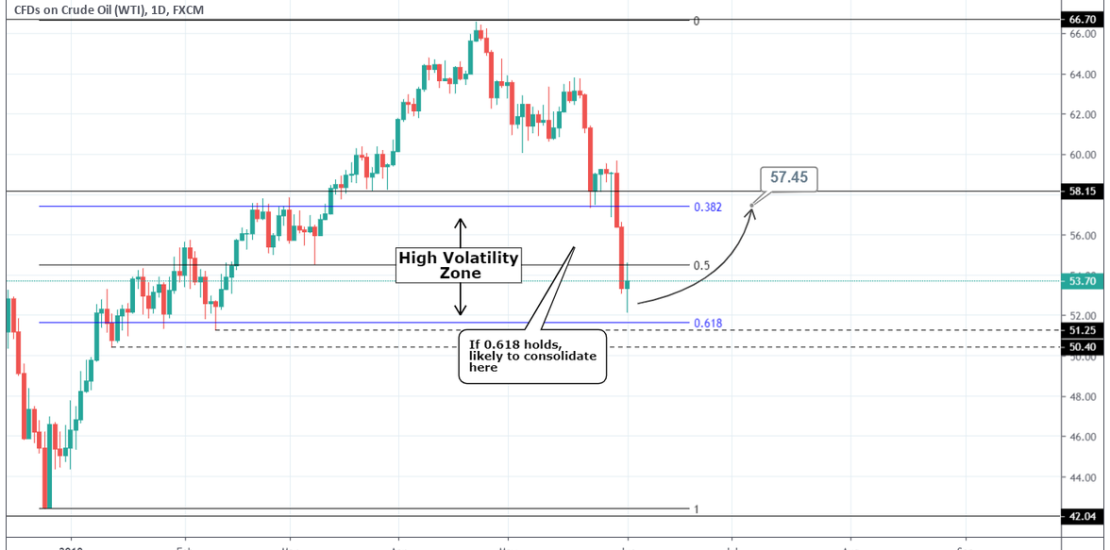
Pattern: Resistance/ Support trading based on Fibonacci levels. Signal: Bullish as the price is near the 0.618 Fibonacci retracement level and the 50.40 – 51.25 1W Support Zone. Target: 57.45 (the 0.382 Fibonacci level which may act as a Resistance). Tradingview link: https://www.tradingview.com/chart/USOIL/a4LSIRUm-WTI-OIL-Buy-Signal
-
BITCOIN mapping $10500
- May 30, 2019
- Posted by: Tradingshot Articles
- Category: Cryptocurrency
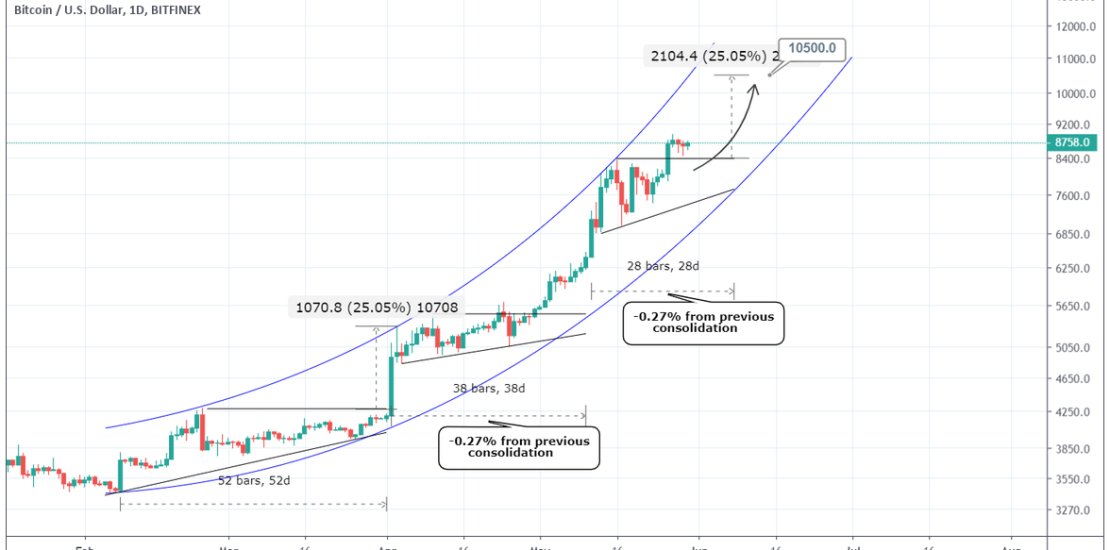
I have attempted to break down the current 4 month parabola into a strong sequence of patterns and what stands out is the Ascending Triangle. Before each aggressive bullish candle sequence within the Parabola, BTC consolidated roughly within an Ascending Triangle formation. When that Triangle broke upwards, an aggressive new Top was made. Assuming that
-
CHFSGD Buy Signal
- May 28, 2019
- Posted by: Tradingshot Articles
- Category: Uncategorized
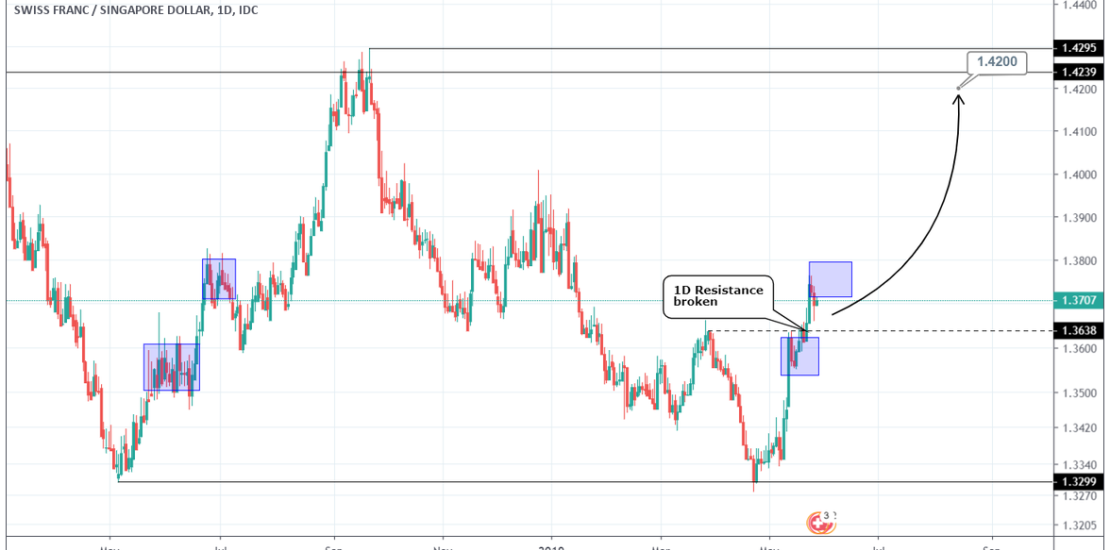
Pattern: Emerging bullish channel on 1D. Signal: Bullish as the price rebounded on the 1W Support and broke the 1D Resistance to start a new medium term uptrend. Target: 1.4200 (just below the 1W Resistance Zone). Tradingview link: https://www.tradingview.com/chart/CHFSGD/SndGPqc7-CHFSGD-Buy-Signal
-
Can this pattern delay Bitcoin’s growth?
- May 25, 2019
- Posted by: Tradingshot Articles
- Category: Cryptocurrency
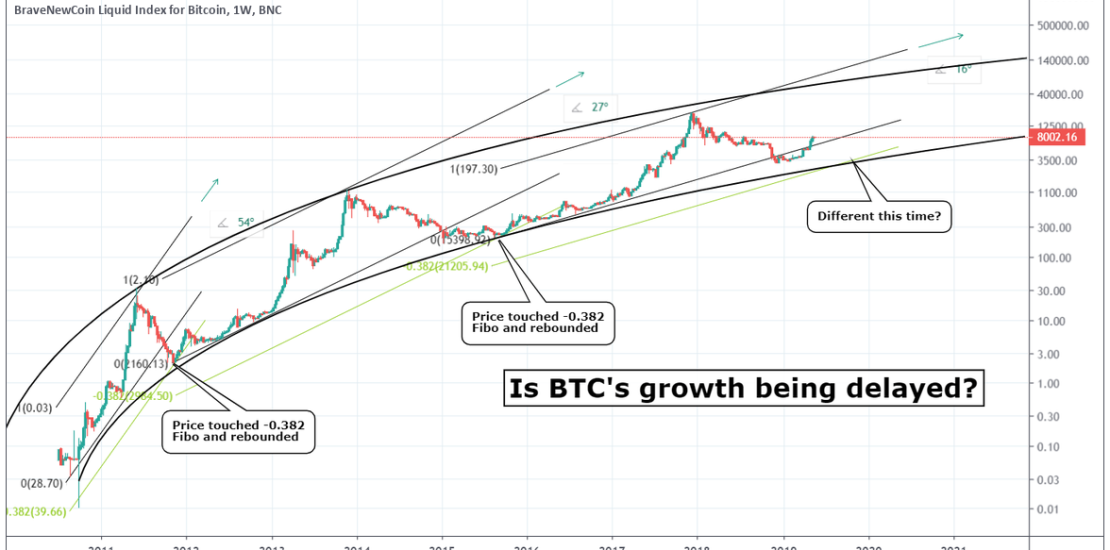
This is a quick reflection on Bitcoin’s Fibonacci Channel’s within its long term parabolic growth curve. In the two previous cycles, the price touched the -0.382 Fibonacci retracement level before it rebounded. This marked the end of that market’s bear cycle and that bottom gave way to the new bull cycle. This time it hasn’t
-
GOLD Sell Signal
- May 16, 2019
- Posted by: Tradingshot Articles
- Category: Uncategorized
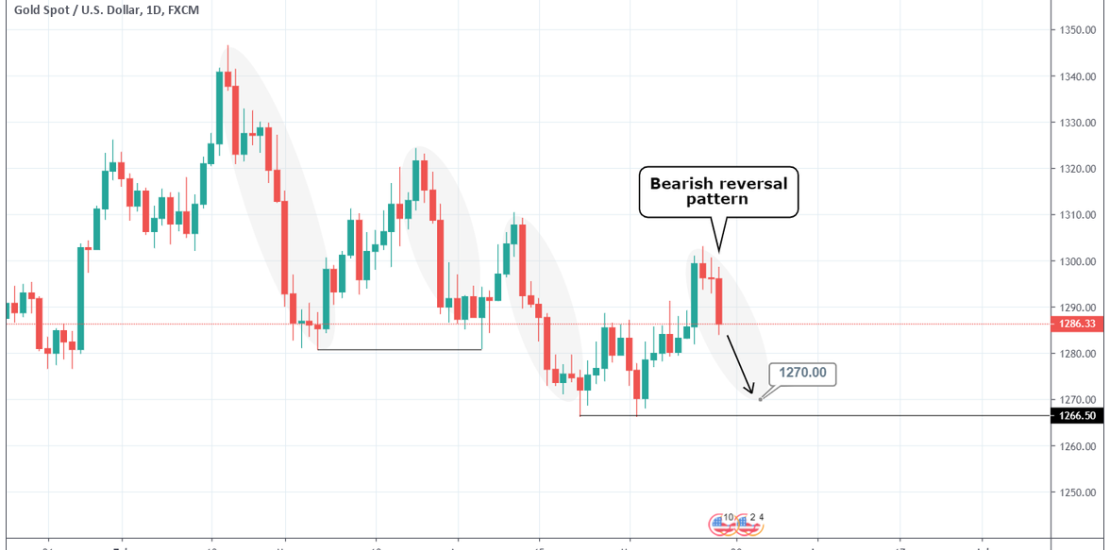
Pattern: Bearish reversal candle pattern on a 1D Lower High sequence. Signal: Bearish after three straight bearish 1D candles printed. Target: 1270 (just above the 1D Support). Tradingview link: https://www.tradingview.com/chart/XAUUSD/17rUZVtT-GOLD-Sell-Signal/
-
GBPNOK Sell Signal
- May 15, 2019
- Posted by: Tradingshot Articles
- Category: Uncategorized
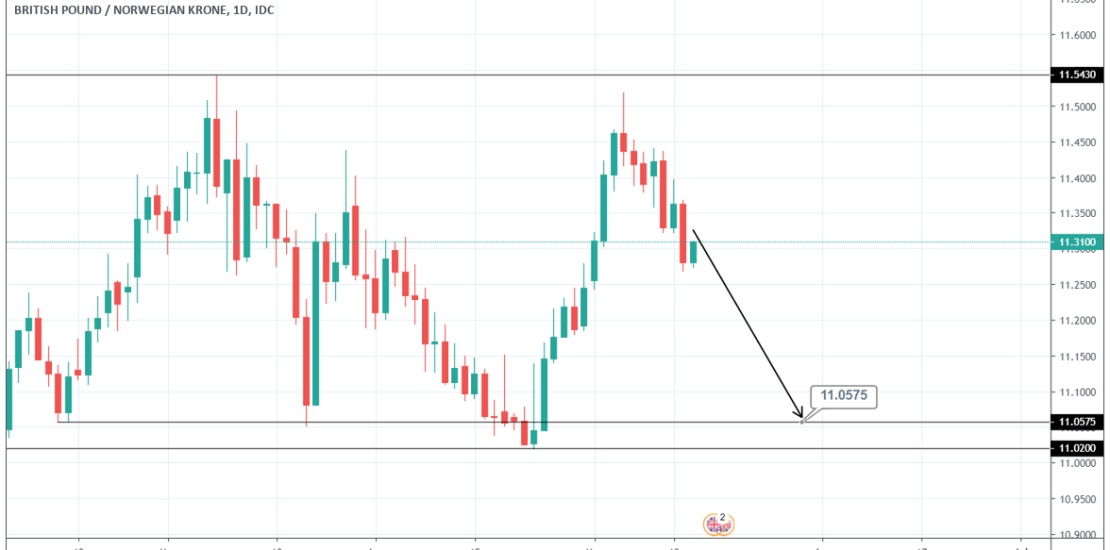
Pattern: Rectangle on 1D. Signal: Bearish after the price was rejected near the 1D Resistance. Target: 11.0575 (top of the 1D Support Zone). Tradingview link: https://www.tradingview.com/chart/GBPNOK/0ZmA7cqf-GBPNOK-Sell-Signal/
-
DASHUSD Buy Signal
- May 14, 2019
- Posted by: Tradingshot Articles
- Category: Uncategorized
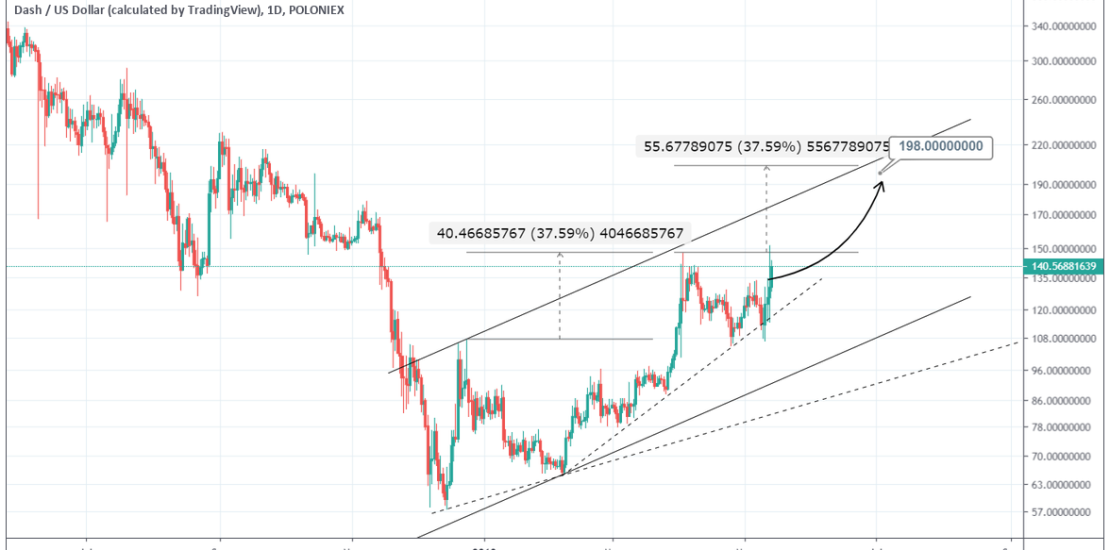
Pattern: 1W Channel Up. Signal: Bullish as every pull back is supported on both inner and outer Higher Lows. Target: 198.000 (structured Higher High growth rate). Tradingview link: https://www.tradingview.com/chart/DASHUSD/S0chRb3r-DASHUSD-Buy-Signal/