
-
BITCOIN Huge Inverse H&S bottoms and targets $41300!
- March 10, 2023
- Posted by: Tradingshot Articles
- Category: Cryptocurrency
No Comments
Bitcoin (BTCUSD) hit its 1D MA200 (orange trend-line) for the first time since January 13, which was half-way through the first rally of the new Bull Cycle. The long-term pattern since the November 21 2022 bottom can be seen as a big Inverse Head and Shoulders (IH&S) that has started to form the Right Shoulder.
-
DXY Excellent sell level, rejection confirmed.
- March 9, 2023
- Posted by: Tradingshot Articles
- Category: Forex
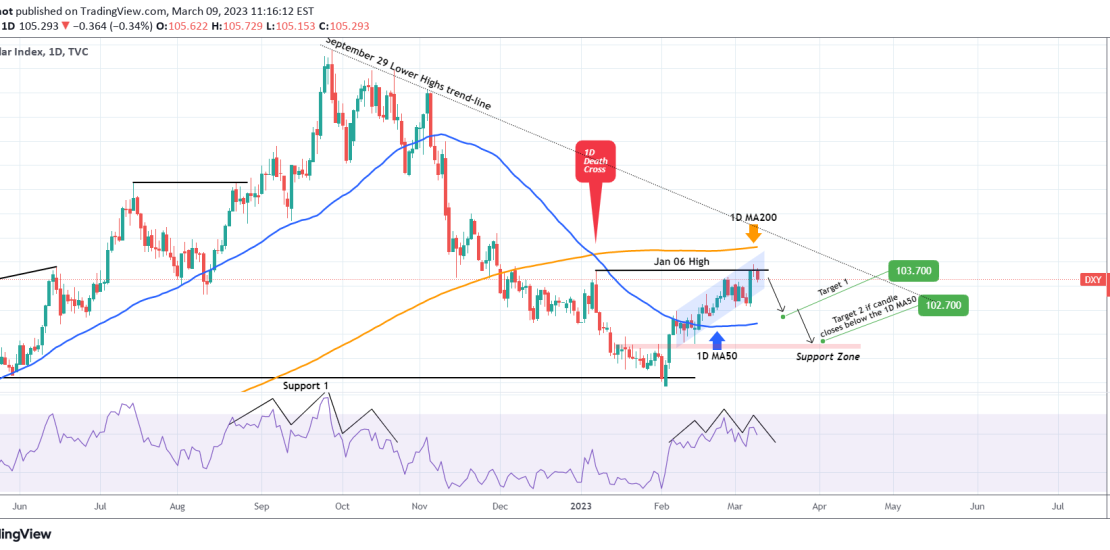
The U.S. Dollar Index got rejected on its January 06 High Resistance and even though it is on a short-term Channel Up, the Resistance rejection as well as mostly the September 29 Lower Highs trend-line, will soon start to weigh sell pressure on the price action. With the 1D RSI printing a Head and Shoulders
-
WTI OIL Sell opportunity halfway through the bearish wave.
- March 9, 2023
- Posted by: Tradingshot Articles
- Category: Commodities
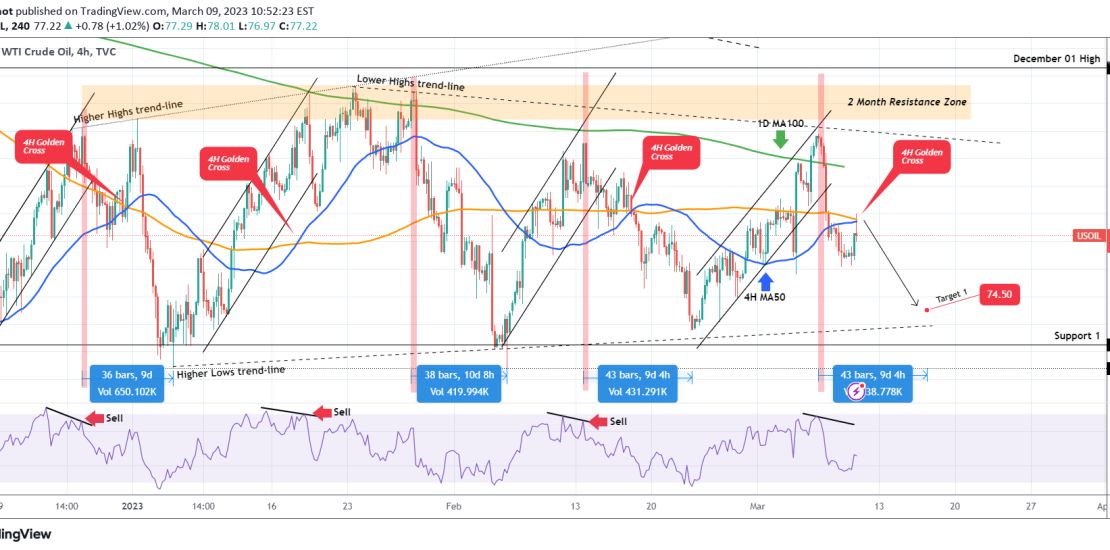
WTI Oil (USOIL) is on a short-term bearish wave after getting rejected on the Lower Highs trend-line of January 23. As the 4H MA50 (blue trend-line) is about to form a Golden Cross with the 4H MA200 (orange trend-line), we are opening a new short-term sell targeting 74.50, right above the Higher Lows trend-line. As
-
BITCOIN Can this wick keep the 2019 fractal alive?
- March 9, 2023
- Posted by: Tradingshot Articles
- Category: Cryptocurrency
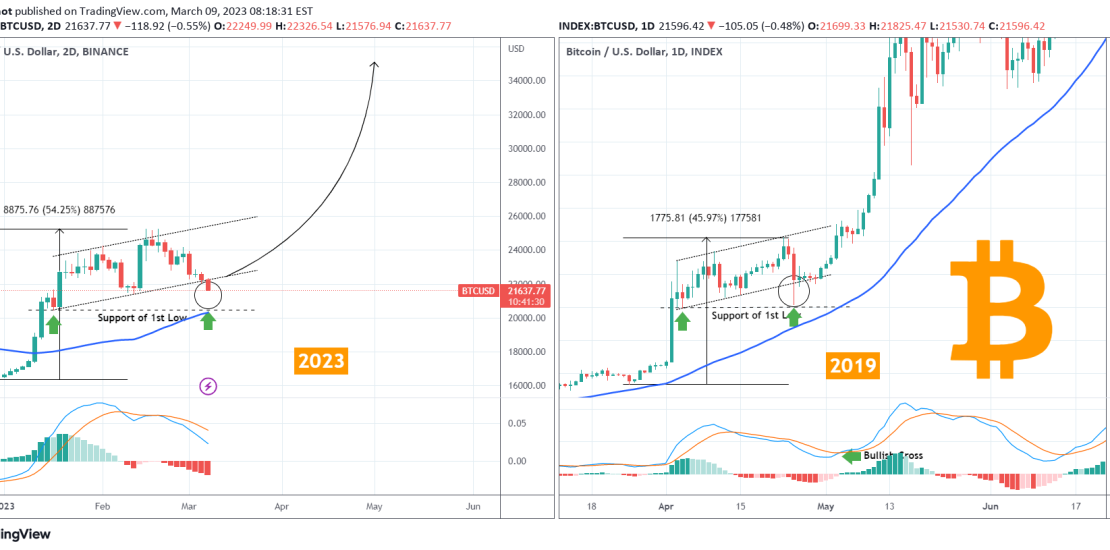
Bitcoin (BTCUSD) is not having the best 3 week stretch as it broke below its 2 month Channel Up. The April 2019 fractal, that has drawn widespread comparisons with the current price action recently, broke its Channel Up on a 1D candle wick, hit the Support made off the 1st Low and rebounded. Once the
-
BITCOIN Hidden Inverse Head & Shoulders pattern points to $165k!
- March 8, 2023
- Posted by: Tradingshot Articles
- Category: Cryptocurrency

As Bitcoin (BTCUSD) is battling to break its 1W MA50 and extend the rally of the new Bull Cycle, as all previous Cycles did, we looked at the 1W time-frame from a different angle and present to you an outlook that may have gone overlooked. As you see, every BTC Cycle Bottom can be viewed
-
EURUSD looking for two support levels
- March 7, 2023
- Posted by: Tradingshot Articles
- Category: Forex
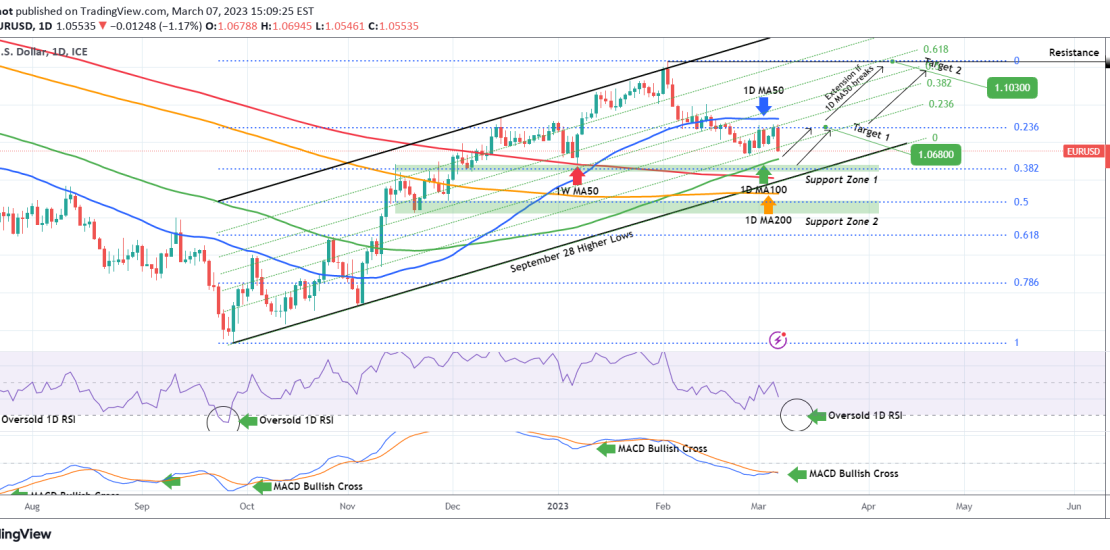
The EURUSD has suffered a strong blow to the recovery it staged last week following Powell’s testimony on a potentially higher pace of interest rate hikes. This analysis is an update to our February 24 thesis, which successfully caught the first rebound: We now added the Fibonacci Channel levels and see that the price is
-
BITCOIN A Fibonacci Circles Roadmap you’ve never seen before!
- March 7, 2023
- Posted by: Tradingshot Articles
- Category: Cryptocurrency

This is a unique representation of the Bitcoin (BTCUSD) Cycles using the Fibonacci Circles, a tool than certainly prints a very interesting Roadmap relative to the previous historic Cycles. The chart focuses on the last two Cycles but for a more complete projection we also incorporate 2015 – 2017. Each Cycle’s epicenter is located on
-
XAUUSD Oversold RSI, bottom of the Channel = Buy opportunity
- March 7, 2023
- Posted by: Tradingshot Articles
- Category: Commodities
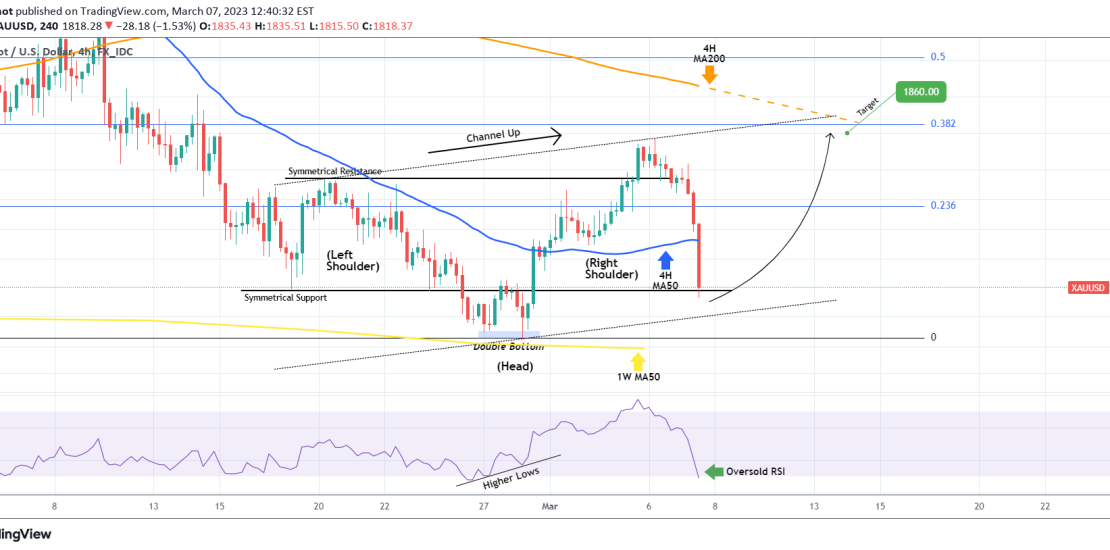
Gold (XAUUSD) got a massive rejection following Powell’s comments on the potential of higher interest rate hikes. It hit the Symmetrical Support level of the Inverse Head & Shoulders pattern we outlined on our previous analysis and so far seems to be rebounding. A potential Channel Up gives room for some more decline before an
-
APPLE Inverse Head and Shoulders give a new All Time High
- March 6, 2023
- Posted by: Tradingshot Articles
- Category: Stocks
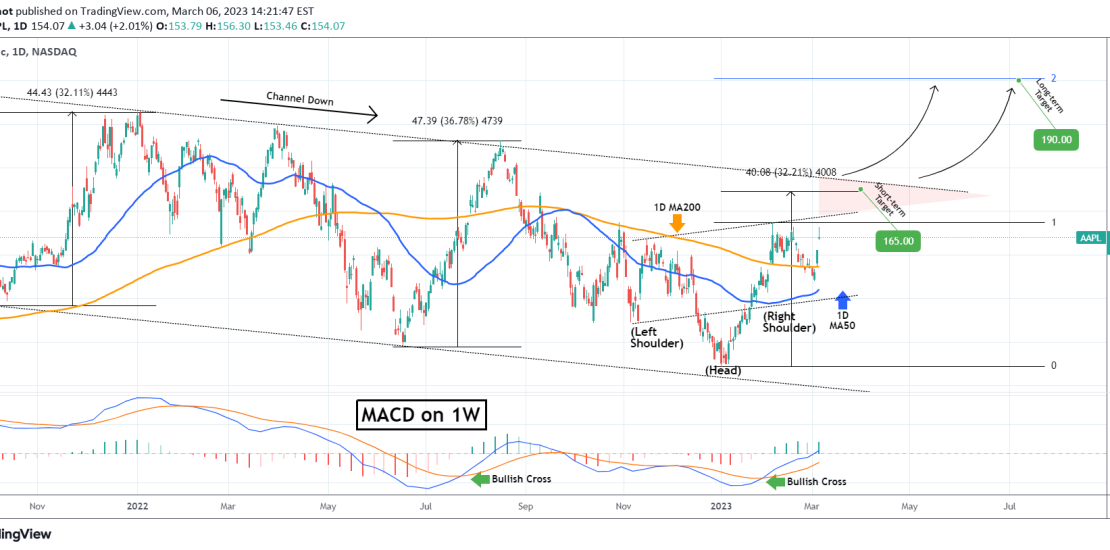
Apple Inc. (AAPL) has just completed an Inverse Head and Shoulders pattern, with its Head being the January 03 market Bottom. The Bear Cycle isn’t technically over for Apple as the Channel Down that started back on the October 04 2021 Low hasn’t yet been broken. In fact since the last two Lower Highs sequences
-
US10Y Double rejection. Targeting the 1D MA200.
- March 6, 2023
- Posted by: Tradingshot Articles
- Category: Other
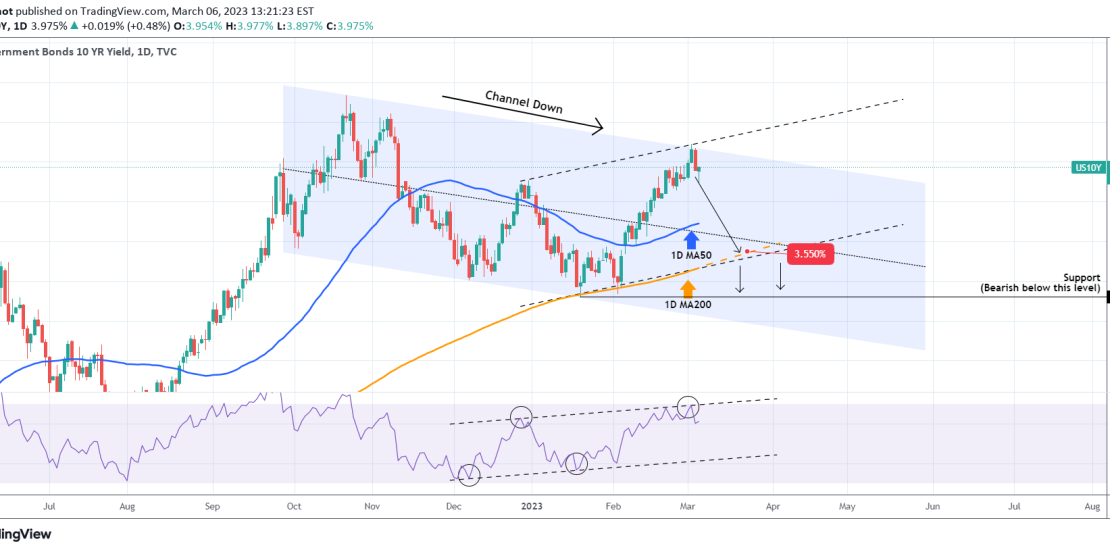
The U.S. Government Bonds 10YR Yield (US10Y) has been trading within a Channel Down pattern ever since the October 21 2022 High and even though there might be a Diverging Channel Up (dashed lines) emerging, the current level makes a strong Resistance cluster. With the 1D RSI also rejected twice on its Higher Highs trend-line,
