

2023
-
DAX is starting a long-term rally to 16100
- March 21, 2023
- Posted by: Tradingshot Articles
- Category: Stock Indices
No Comments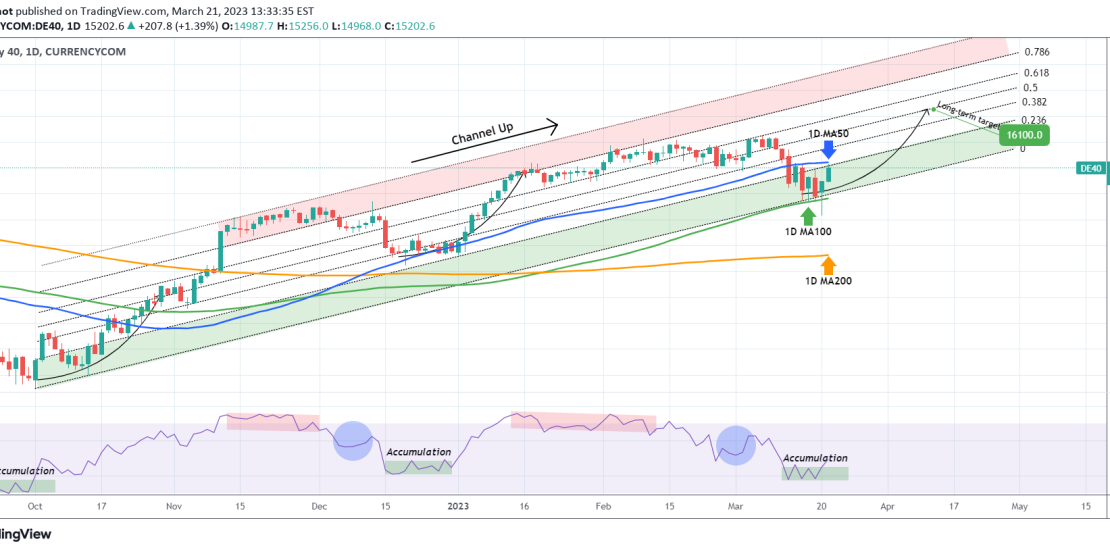
DAX is now testing the 1D MA50 (blue trend-line) having rebounded at the bottom of its long-term (since the October 03 Low) Channel Up and the 1D MA100 (green trend-line). With the 1D RSI coming out of its Accumulation Zone, as in the previous two Lows (late September and late December 2022), we expect this
-
DOW JONES has started the new bullish wave.
- March 21, 2023
- Posted by: Tradingshot Articles
- Category: Stock Indices
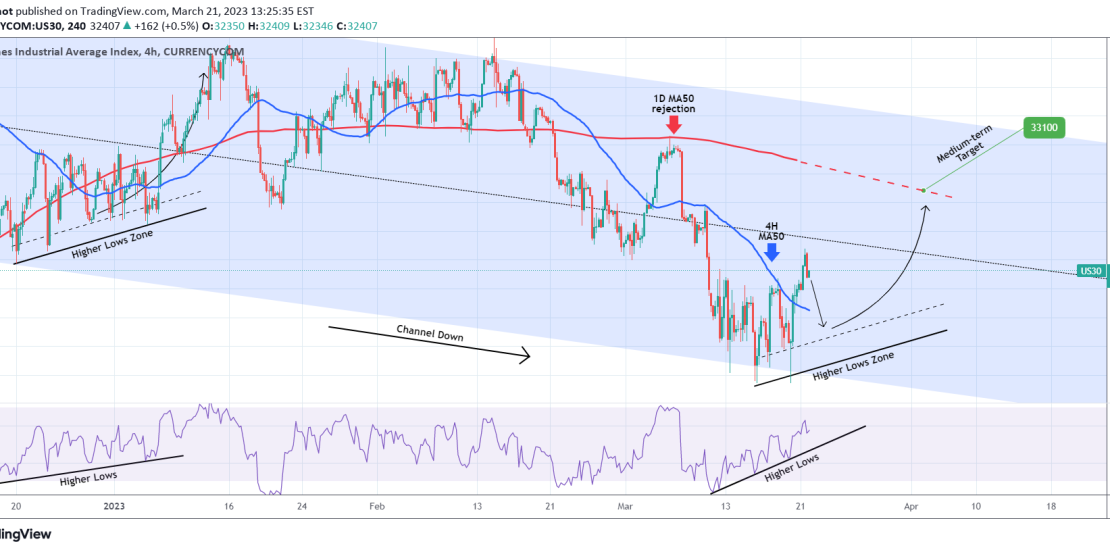
This is basically to last week’s buy signal at the bottom: As you see Dow Jones (DJI) made a new Lower Low (bottom) on the 4-month Channel Down and broke above the 4H MA50 (blue trend-line) again. The move is supported by a Higher Lows Zone (as is the RSI), similar to the previous Channel
-
WTI OIL Inverse Head and Shoulders cementing the bottom.
- March 21, 2023
- Posted by: Tradingshot Articles
- Category: Commodities
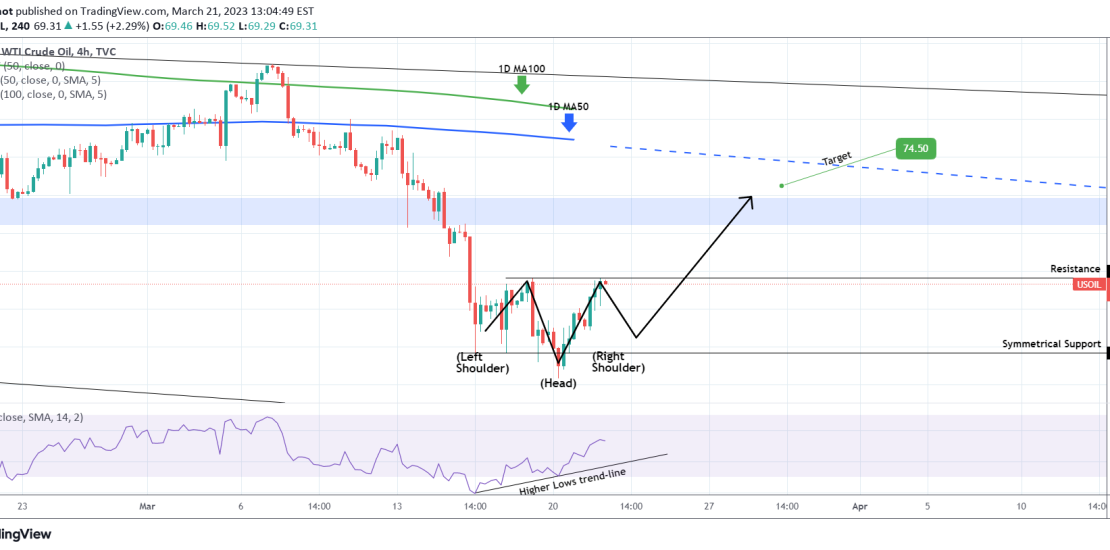
WTI Oil (USOIL) is forming an Inverse Head and Shoulders (IH&S) pattern on the 4H time-frame, which is a technical bottom and bullish reversal formation. The 4H RSI is on a Higher Lows trend-line, indicating an uptrend and already above the 50.00 neutral mark. One last pull-back to the 65.70 Symmetrical Support is possible, before
-
S&P500 Best buy signal since early January.
- March 20, 2023
- Posted by: Tradingshot Articles
- Category: Stock Indices
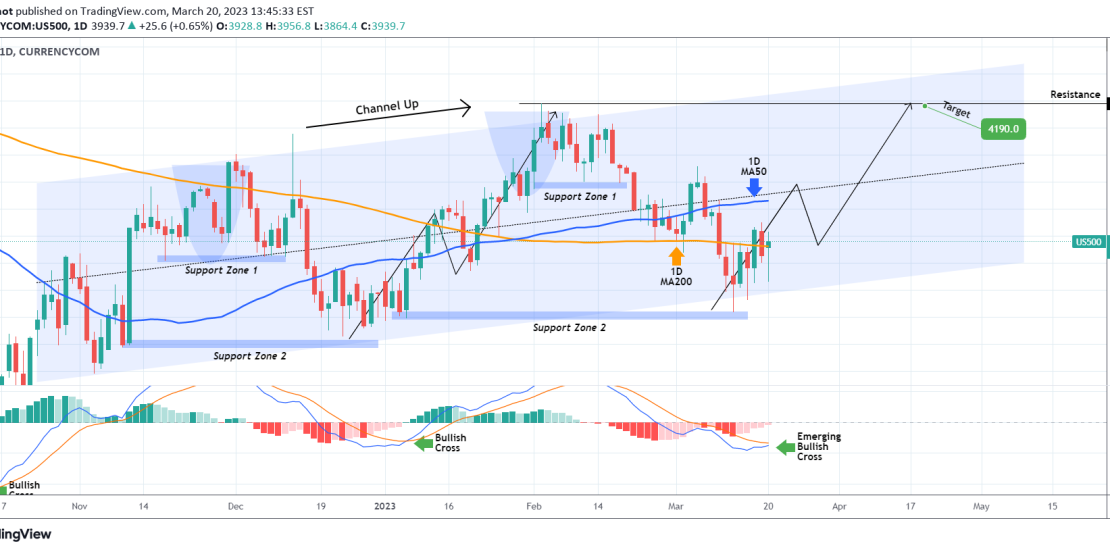
The S&P500 index (SPX) is on a 1 week rebound following the March 13 Low which was made on Support Zone 2 and is so far on the bottom of the 5-month Channel Up. All candles have closed inside this pattern and as you see so far every bearish and bullish wave follows similar structure
-
DXY Huge H&S about to break downwards aggressively
- March 17, 2023
- Posted by: Tradingshot Articles
- Category: Forex
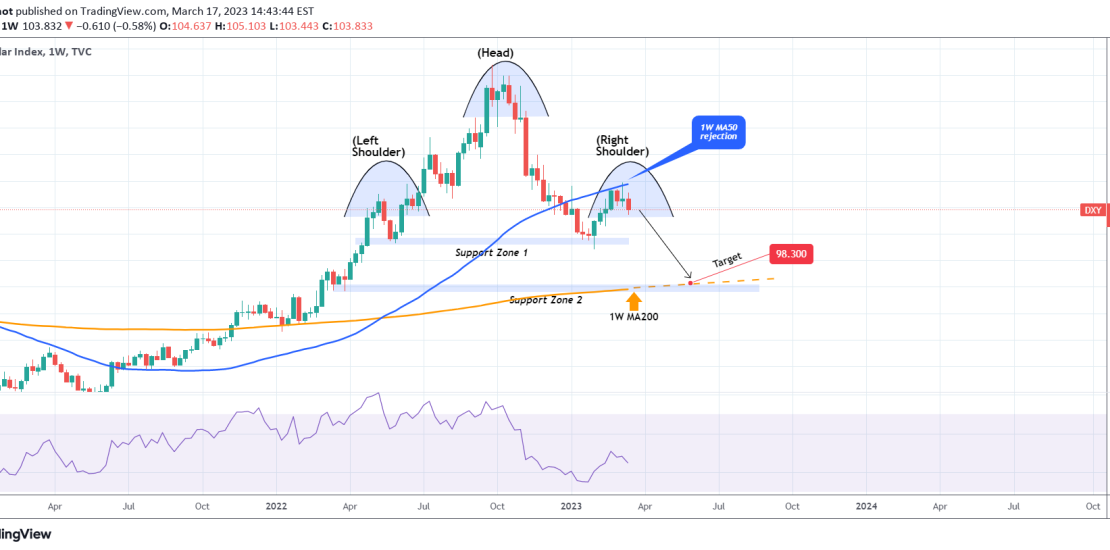
The U.S. Dollar Index (DXY) has hit our first short-term target as presented on our most recent analysis: The major news however is that it failed to break above its 1W MA50 (blue trend-line) where in fact it got rejected last week. This validates the giant Head and Shoulders (H&S) idea we discussed in the
-
NASDAQ flipped the Bear Cycle and the 1D MA200 is now supporting
- March 17, 2023
- Posted by: Tradingshot Articles
- Category: Stock Indices
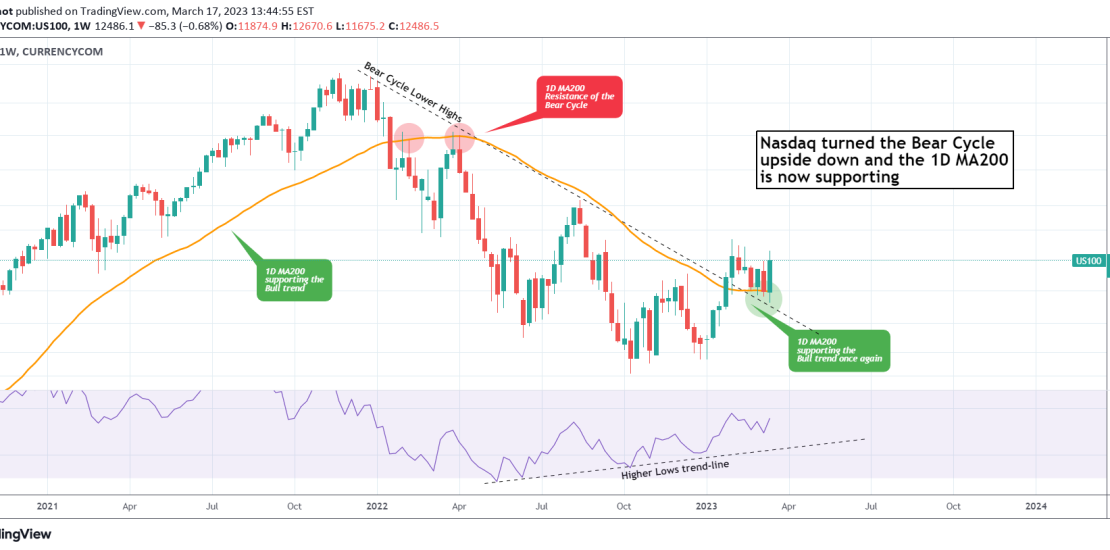
Nasdaq (NDX) rebounded yet another week on the Bear Cycle Lower Highs trend-line and has recovered all the losses of the previous three. On top of that, this is the 7th straight 1W candle close above the 1D MA200 (orange trend-line), which as you see on this 1W chart, it was been the Resistance during
-
BITCOIN The party has started and has another 33 months left!
- March 17, 2023
- Posted by: Tradingshot Articles
- Category: Cryptocurrency
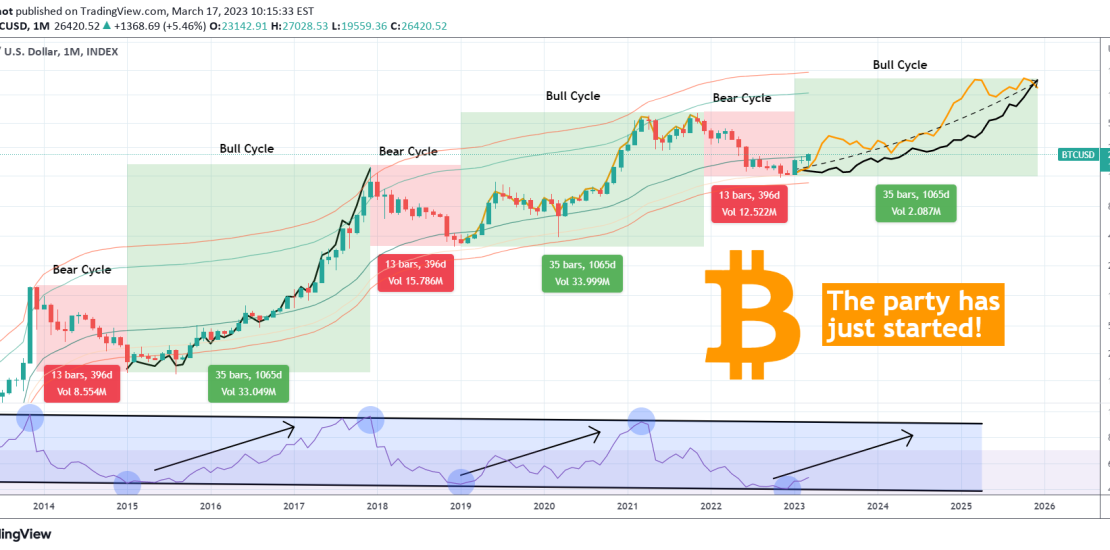
Bitcoin (BTCUSD) gives us a very clear picture with regards to its long-term Cycles on the 1M (monthly) time-frame. As you see, once the 1M RSI hit the bottom (Lower Lows trend-line) of its 10 year Channel Down, BTC bottomed and the new Bull Cycle started. This Bull Cycle should last for approximately 35 months
-
DOW JONES is forming a bottom, aiming at the 1D MA50 again.
- March 16, 2023
- Posted by: Tradingshot Articles
- Category: Stock Indices
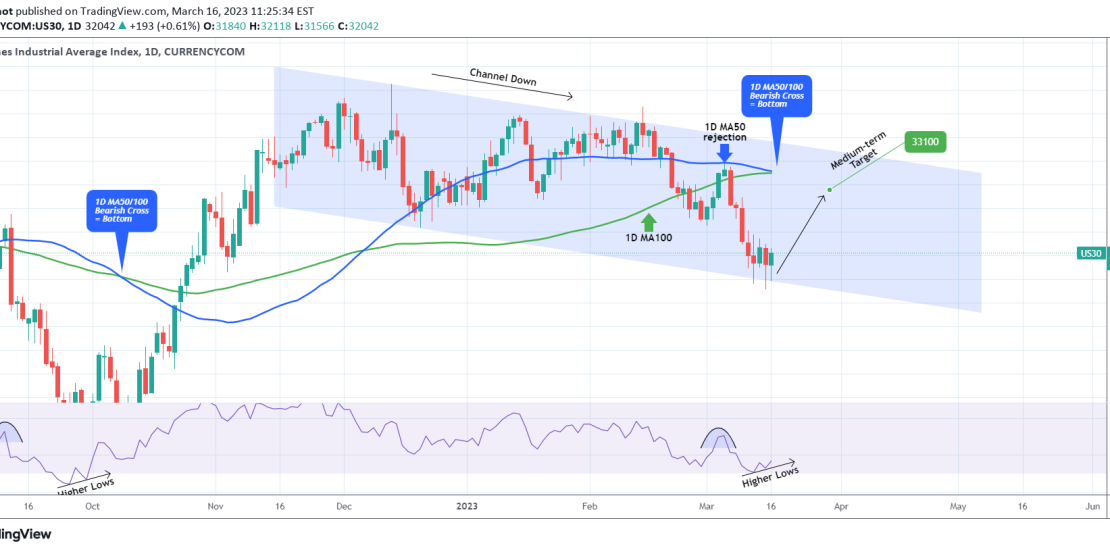
Dow Jones (DJI) is trading sideways for the 4th straight 1D candle on the bottom (Lower Lows trend-line) of the long-term Channel Down. As the 1D RSI touched the 30.00 oversold level and rebounded, similar to the September 27 bottom, while the 1D MA50 (blue trend-line) crossed below the 1D MA100 (green trend-line) to form
-
WTI OIL Excellent long-term buy opportunity.
- March 16, 2023
- Posted by: Tradingshot Articles
- Category: Commodities
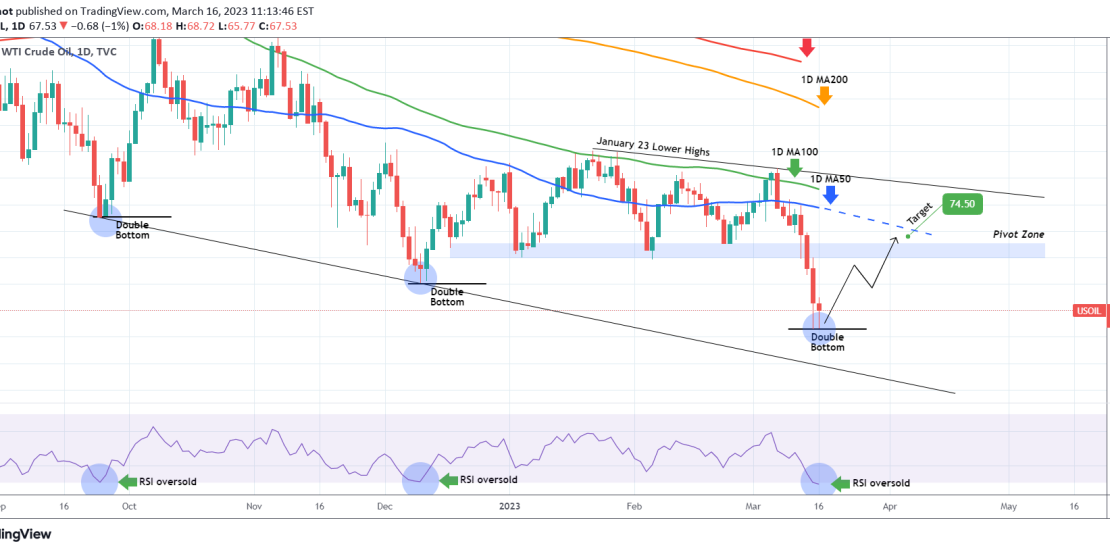
WTI Oil (USOIL) got its 1D RSI oversold below 30.00 as the market made a new Low since December 09. The last two times the 1D RSI was that low was on the medium-term (Lower) Lows of December 09 and September 26. This is a strong buy signal as every time the Low was priced,