2023 May
-
BITCOIN will extend the rally based on the alts market cap!
- May 19, 2023
- Posted by: Tradingshot Articles
- Category: Cryptocurrency
No Comments
Bitcoin (BTCUSD) has been on a 1 month pull-back ever since it started the new Bull Cycle rally at the start of this year. We have compared the current Cycle to that of 2015-2017 numerous times and as the market fears (yet again) of a stronger correction/ major trend reversal, the Crypto Total Altcoin Market
-
BITCOIN 1W Ichimoku turns green = final BUY SIGNAL!!
- May 18, 2023
- Posted by: Tradingshot Articles
- Category: Cryptocurrency
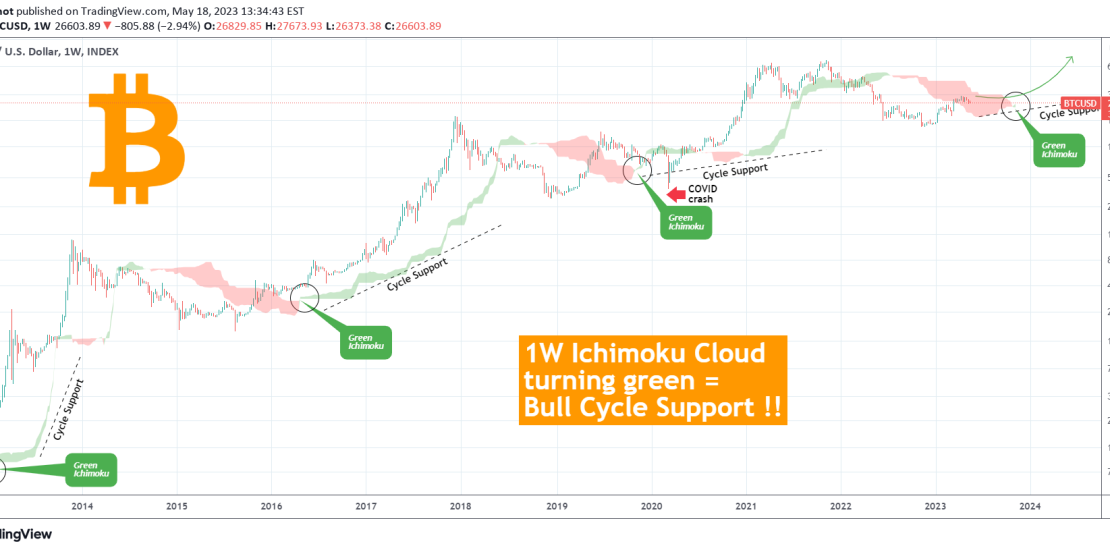
Bitcoin (BTCUSD) turned its Ichimoku Cloud green again on the 1W time-frame for the first time since July 2022. However it is the first time that it goes from red to green since December 2020 and if it wasn’t for the March 2020 COVID crash, it would have been the first since November 2019! This
-
EURUSD within the 1D MA50-100. Trade the break-out.
- May 18, 2023
- Posted by: Tradingshot Articles
- Category: Forex
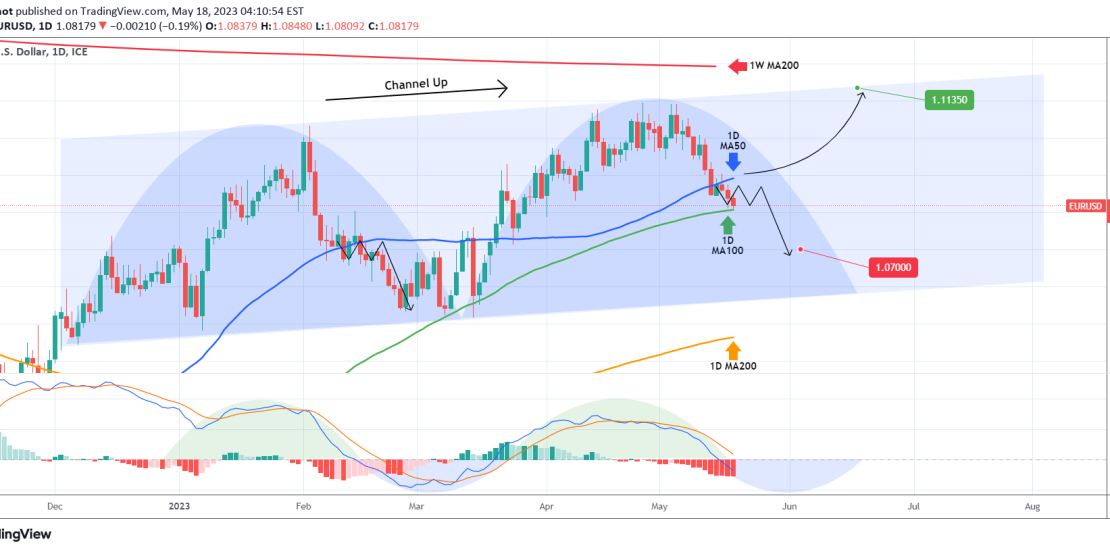
The EURUSD pair is still trading inside the long-term Channel Up pattern we identified more than 2 months ago and bought the bottom (see chart below): With the recent price action however, we shift our attention to a shorter term Channel Up due to the possibility of extending the recent selling. The pair is basically
-
BITCOIN Is approaching its bottom. Will you buy this?
- May 17, 2023
- Posted by: Tradingshot Articles
- Category: Cryptocurrency
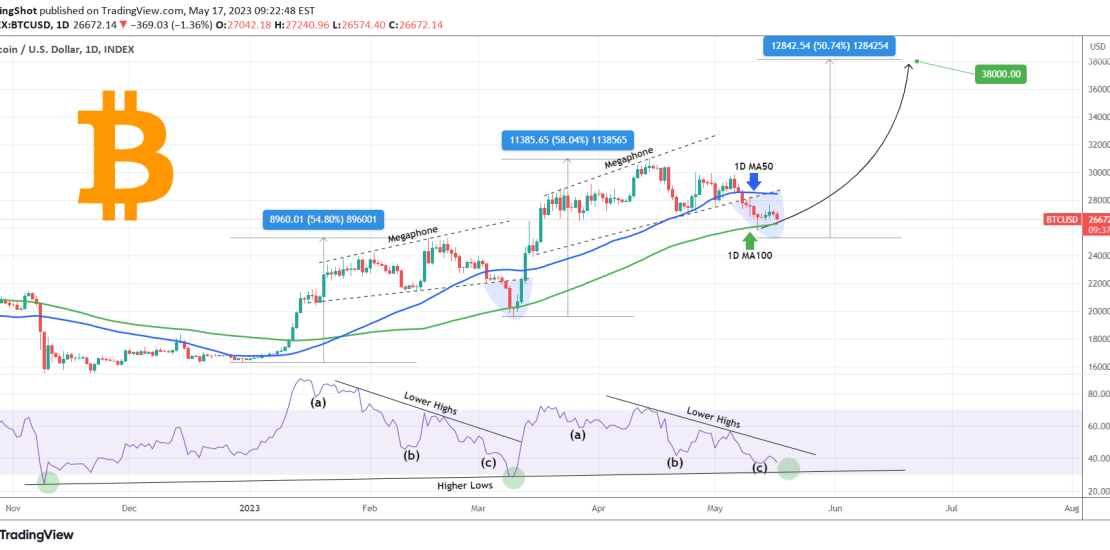
Bitcoin (BTCUSD) is trading again back towards its 1D MA100 (green trend-line) after rebounding on it a few days ago. This is a minor bearish signal on the short-term as the previous hit and pump on the 1D MA100 (March 09) delivered a massive rebound instantly. The 1D RSI however shows that the bottom is
-
S&P500 The Cup pattern that nobody notices!
- May 17, 2023
- Posted by: Tradingshot Articles
- Category: Stock Indices
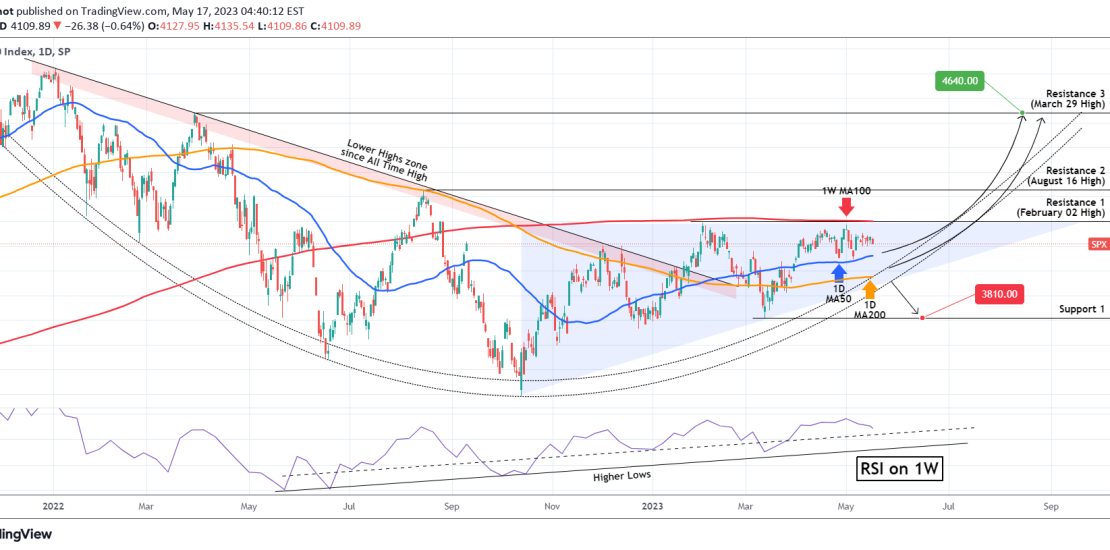
We have been so focused on the short-term Channel Up on the S&P500 (SPX) since March (see idea below) that we didn’t publish any analysis on the longer term dynamics: This analysis offers critical insight on where we are with regards to the long-term/ Cyclical trend. One parameter that stands out is that the S&P500
-
PALLADIUM Buy opportunity on the 1D MA50.
- May 17, 2023
- Posted by: Tradingshot Articles
- Category: Commodities
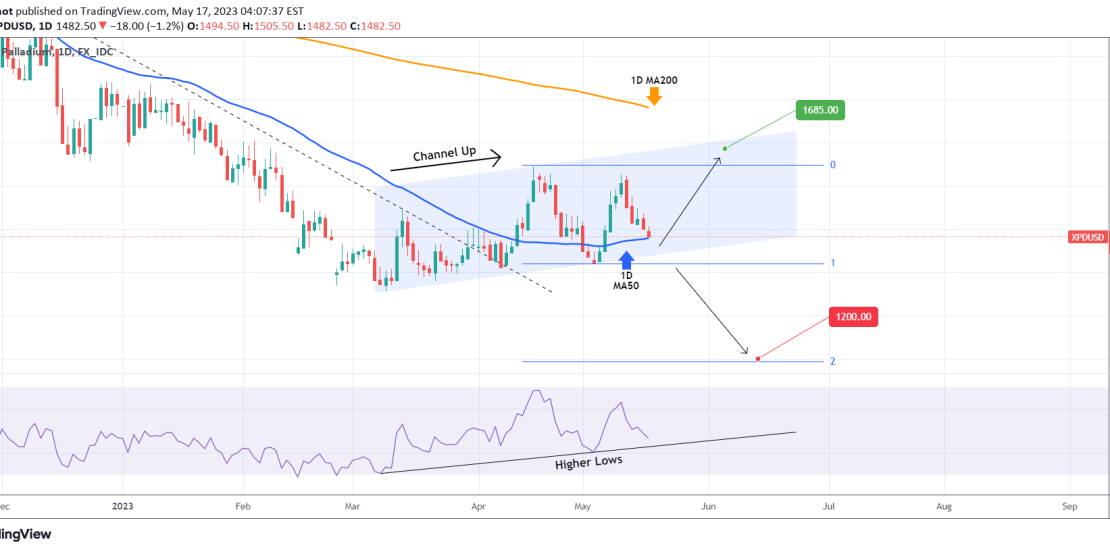
Last time we looked into Palladium (XPDUSD) is was almost a year ago: This time the price has formed a Channel Up pattern after breaking above the dashed Lower Highs trend-line form the October 04 2022 High. The price is exactly on the 1D MA50 (blue trend-line) now, near the bottom of the Channel Up,
-
NASDAQ broke above the 1W MA100 after a year!
- May 16, 2023
- Posted by: Tradingshot Articles
- Category: Stock Indices
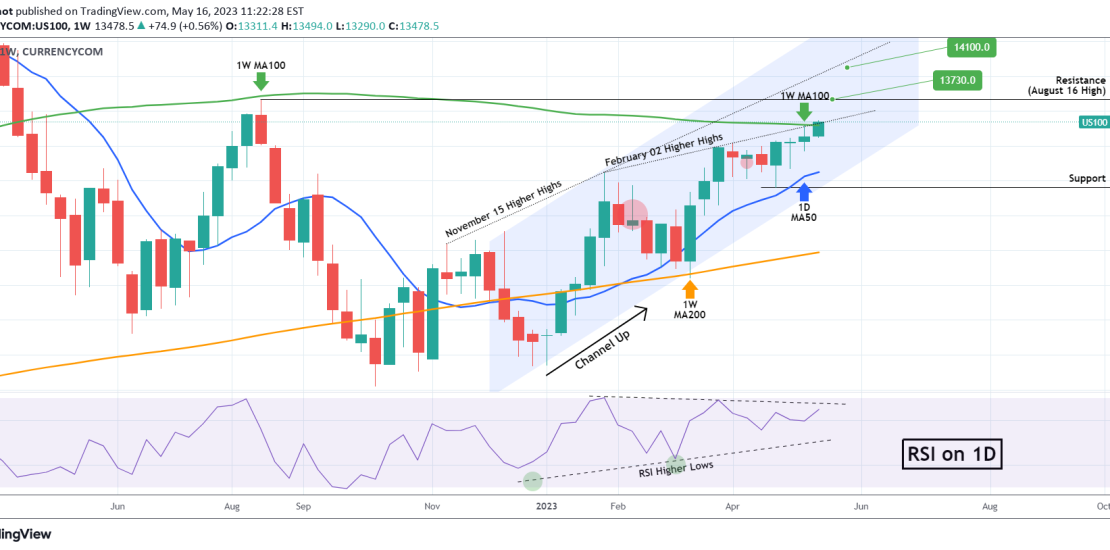
Nasdaq (NDX) is extending the bullish trend inside the short-term Channel Up as mentioned on are recent idea two weeks ago (see below): Today the index reached a very important benchmark as it broke above the 1W MA100 (green trend-line) for the first time in more than 1 year (since the 1W candle of April
-
USDSGD Triangle break-out. Buy signal.
- May 16, 2023
- Posted by: Tradingshot Articles
- Category: Forex
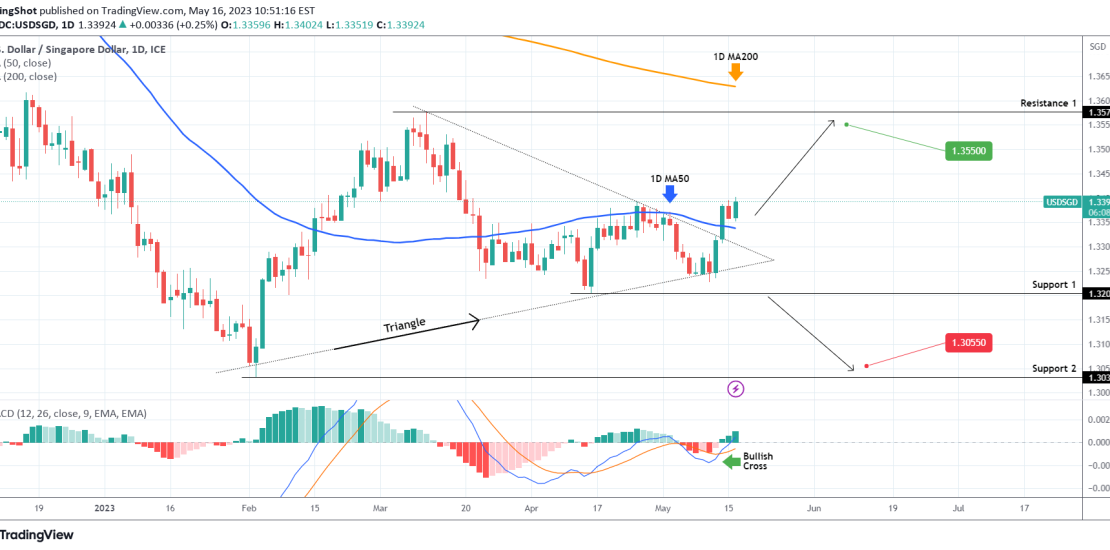
Last time we looked at the USDSGD pair (October 11 2022) we gave the best sell signal possible (see idea below) as the price entered the 6 year Resistance Zone: This time we have a buy signal flashing as the price not only broke above the Triangle pattern on the 1D time-frame but also above
-
USDCNY Approaching a 2 month Resistance on overbought RSI.
- May 15, 2023
- Posted by: Tradingshot Articles
- Category: Forex
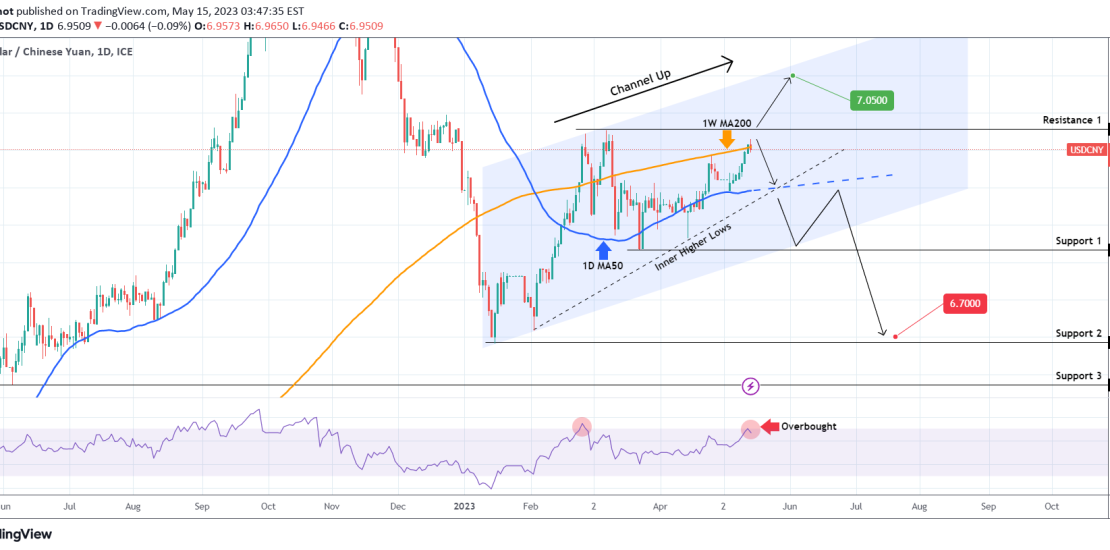
It’s been a long time see we last traded the USDCNY pair (see chart below) but it was a long-term trade that very precisely hit the both the 1D MA200 (orange trend-line) and 1W MA100 (red trend-line) targets: After the January 16 rebound, the pair former a Channel Up and currently the price is approaching
-
BITCOIN hit the 1W MA200 after 2 months! Stocks may show the way
- May 12, 2023
- Posted by: Tradingshot Articles
- Category: Cryptocurrency
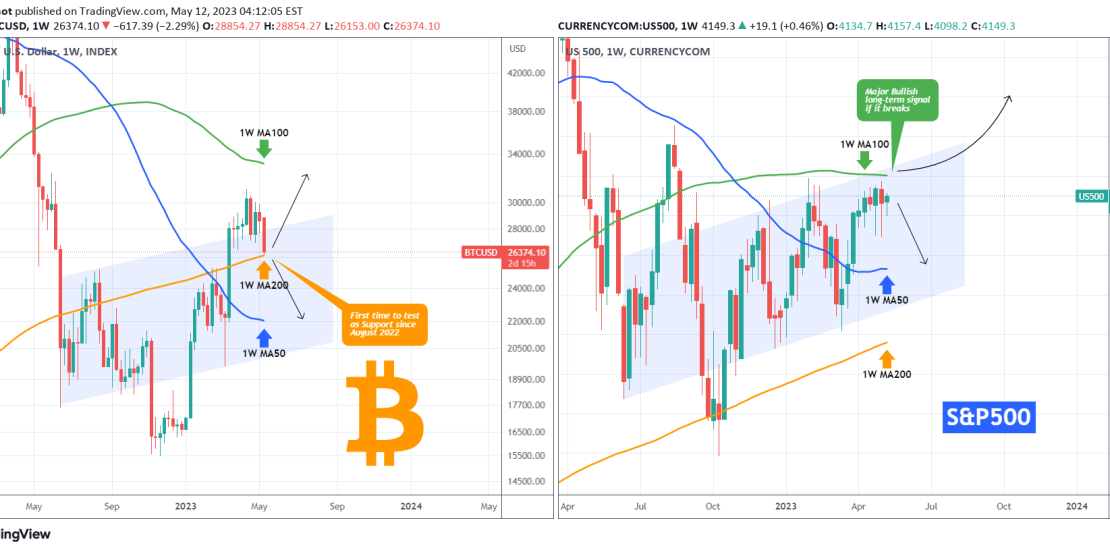
Bitcoin (BTCUSD) hit today the 1W MA200 (orange trend-line) for the first time since the March 13 weekly bullish break-out. Basically this is the first time that the 1W MA200 is being tested as a Support since the weekly candle of August 15 2022. If it holds, it will be confirmed most likely as a

