

- April 4, 2023
- Posted by: Tradingshot Articles
- Category: Commodities
WTI Oil (USOIL) hit our medium-term target last week but following OPEC’s cuts, it opened with a big gap up on Monday:

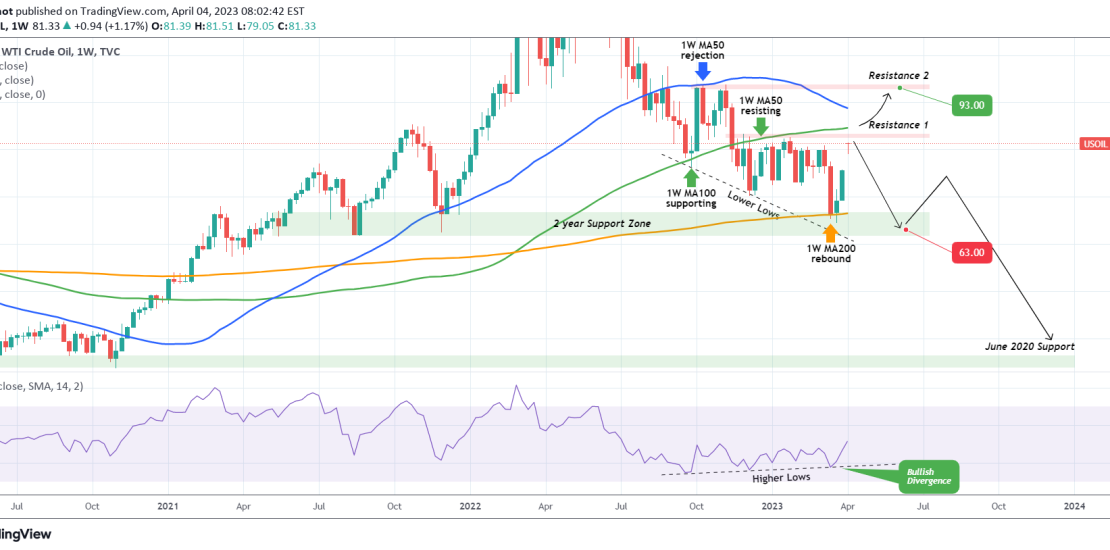
In order to more effectively understand the market dynamics after this move, it is best to view Oil on the 1W time-frame where we see all key characteristics of this move. First the rebound 2 weeks ago started after the price tested the 1W MA200 (orange trend-line) for the first time since February 01 2021. The price closed back above it and the rebound landed us to where we are now.
This is just shy off Resistance Zone 1, which is holding since November 2022. This calls for the most optimal sell opportunity on a quarterly basis, targeting again the 1W MA200 and the 2 year Support Zone at 63.00.
However with the 1W RSI on Higher Lows i.e. a Bullish Divergence against the candles’ Lower Lows, we have to consider the probability of a potential bullish break-out. Since the 1W MA50 was a long-term Support turned into Resistance that hasn’t allowed a 1W candle close above its since November 2022, we are willing to buy only if we close above it. The target on that occasion will be 93.00 (Resistance 2).
Tradingview link:
https://www.tradingview.com/chart/USOIL/tIKWmMZu-WTI-OIL-Near-a-long-term-Resistance