

- March 24, 2023
- Posted by: Tradingshot Articles
- Category: Cryptocurrency
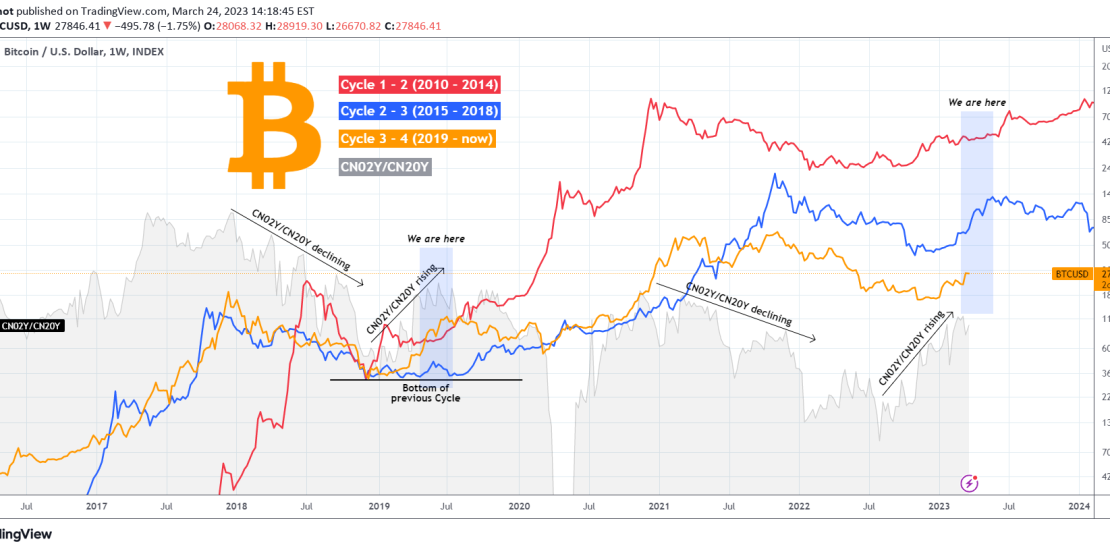
This is not the first time we incorporate the Chinese bond yields element (CN02Y/CN20Y) to Bitcoin (BTCUSD) analysis, but it is the first time we do so in such an illustrative way by displaying all Cycles from a common starting point. We have made a case in the past how strong of a correlation the Chinese bond market has with Bitcoin and how efficiently that can predict its Cycles.
As you see on the chart, each Cycle portrays a certain period: Red = Cycle 1 -2 (2010 – 2014), Blue = Cycle 2 – 3 (2015 – 2018) and Orange = Cycle 3 – 4 (2019 – now). The CN02Y/CN20Y ratio is displayed in Grey. A key characteristic is that all Cycles have a common start, the bottom of the previous one. We see the effect of diminishing returns as each Cycle is less aggressive (naturally) from the previous one.
We also see the strong connection with CN02Y/CN20Y, as when the ratio starts declining, BTC enters a Bear Cycle, and once the ratio starts rising, BTC initiates a Bull Cycle. Right now it appears that we are at the point where the CN02Y/CN20Y ratio typically peaks and consolidates, which for BTC is translated to the time it breaks above its 1W MA50 and practically starts a new aggressive rally, the first of the new Bull Cycle.
Based on this model, Bitcoin should extend the rally it started this year. Do you agree? Feel free to let us know in the comments section below!
Tradingview link: