

- March 22, 2023
- Posted by: Tradingshot Articles
- Category: Commodities
Those who follow us for long, know that we tend to utilize long-term patterns, especially cyclical pattern that give a high probability of return as they filter out the day-to-day noise from the news. Natural Gas (NG1!) is no exception and our multi-year Cycles analysis last January proves that:

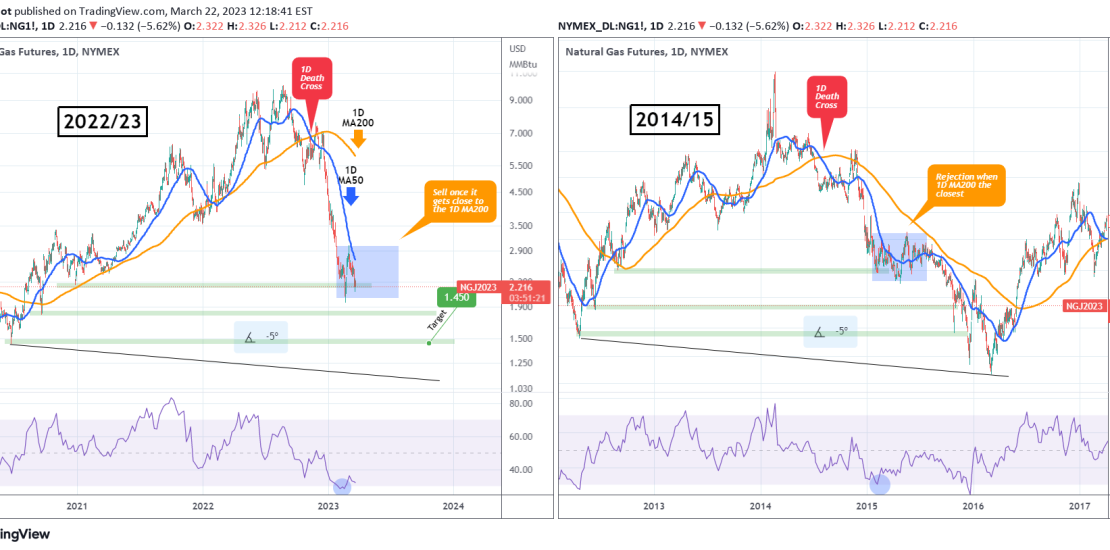
As the price continued to free-fall, we now find it useful to better explain the situation to you, to turn back to the 1D time-frame and compare the 2022/23 Cycle to 2014/15. As you see the correlation is fairly high. Both started on a 1D Death Cross, with the 1D RSI deeply overbought. As the price never broke above the 1D MA50 (blue trend-line) since December 20 2022, it appears that we are in a similar level as February 2015 when after a test of the first Support Zone (green), the price rebounded, got rejected on the 1D MA50 and then turned sideways to break it.
It stayed neutral for basically 6 months before starting a new multi-month round of heavy selling. The signal to sell it again was when the price was at its closest to the 1D MA200 (orange trend-line). The downside potential is significant and goes lower than the previous Low of 1.450, which is our long-term target.
Tradingview link: