- March 22, 2023
- Posted by: Tradingshot Articles
- Category: Cryptocurrency

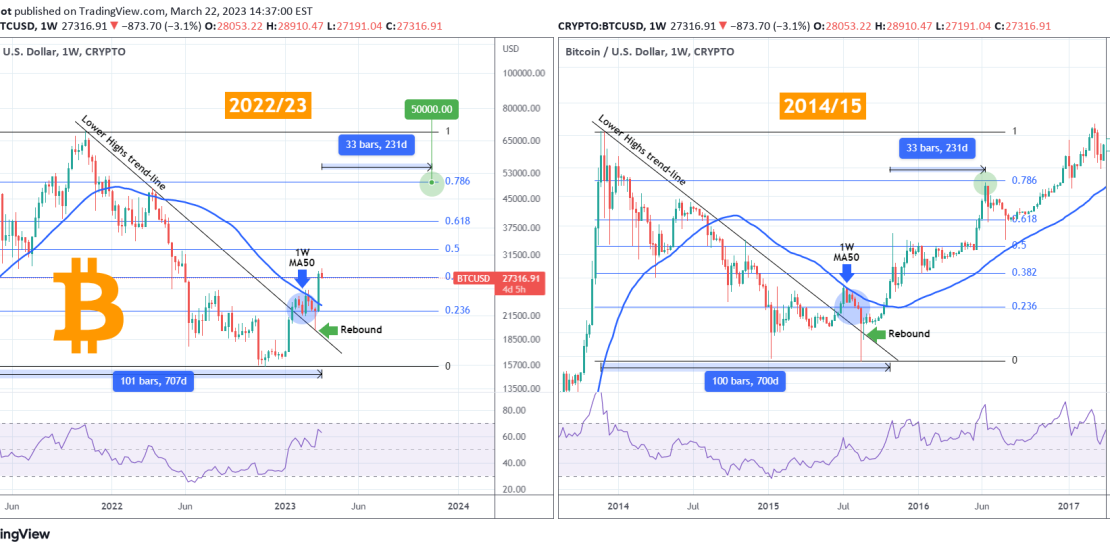
Bitcoin (BTCUSD) satisfied those that kept comparing the 2022/23 Cycle to the 2014/15 one as after the a clear rejection on the 1W MA50 (blue trend-line), it rebounded on the Cyclical Lower Highs trend-line and since last week it closed above it as well as the 0.382 Fibonacci retracement level.
This symmetry is remarkable and it doesn’t stop here. Right now we are 101 weeks after the Cycle’s true technical top on the week of April 12 2021. Notice that the 2nd week following the first 1W candle closing above the 1W MA50 in 2015 was on the October 26 2015 candle. That was 100 weeks after the Cycle Top!
If this amazing symmetry continues to hold, then we can expect BTC to reach the 0.786 Fibonacci level in 33 weeks from now, i.e. on the 1W candle of November 06 2023. That gives an exact target of $50000.
Do you think this pattern will hold until then? Feel free to let us know in the comments section below!
Tradingview link:
https://www.tradingview.com/chart/BTCUSD/3F1yDYAh-BITCOIN-50000-is-a-realistic-target-by-November

