

- February 28, 2023
- Posted by: Tradingshot Articles
- Category: Cryptocurrency
No Comments
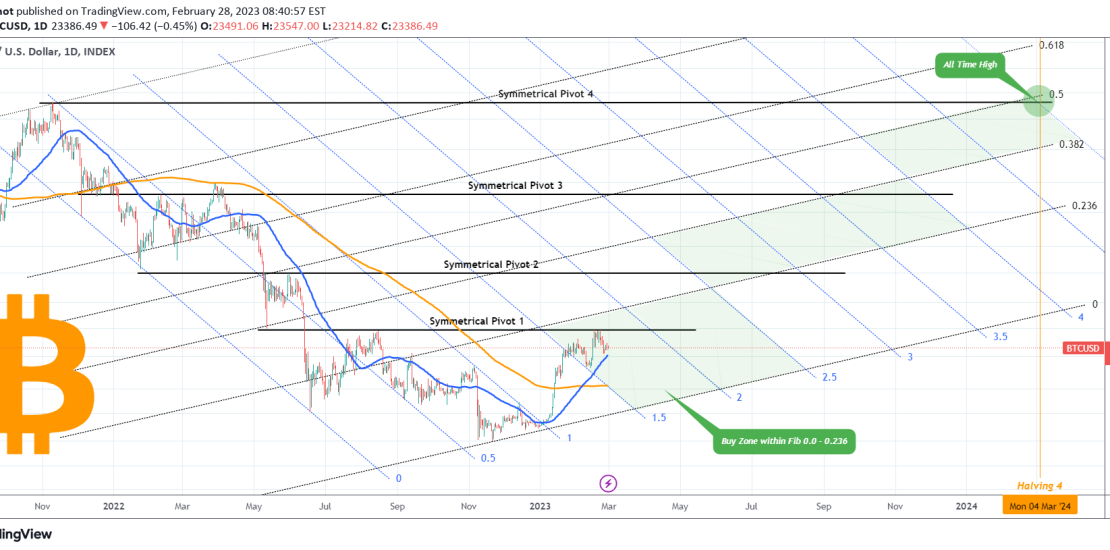
This is a unique analysis of Bitcoin displayed on a grid pattern made of the Fibonacci retracement levels (black trend-lines) applied from the top of the previous Bull Cycle to the bottom of the Bear Cycle and the Fibonacci extension levels (blue trend-lines) applied on the Lower Lows and Lower Highs of the Bear Cycle.
Using the Symmetrical Pivots as the new Resistance levels/ gaps to be filled, we have mapped a potential course using those as targets on Bitcoin’s way to reach its $69000 All Time High by Halving 4 (March 2024).
Can that be useful in identifying potential volatility zones and mapping a course on this Bull Cycle that has just started? Feel free to let us know in the comments section below!
Tradingview link: