

- February 14, 2023
- Posted by: Tradingshot Articles
- Category: Cryptocurrency
Why don’t we see the Pitchfork tool applied to Bitcoin (BTCUSD)? We show on today’s analysis that this often very overlooked technical tool has been particularly spot on at identifying BTC’s Bull Runs.
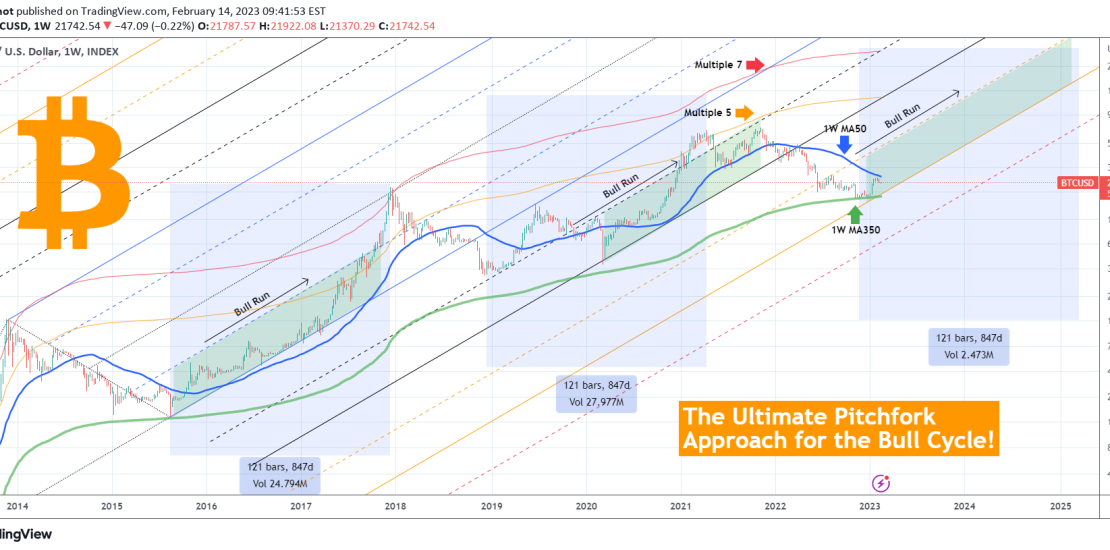
It is a simple application and we will keep the commentary that way. As you see on this 1W time-frame, we have applied the Pitchfork from Bitcoin’s first Low to the 2014/15 Bear Cycle. As you see the Fibs drawn, provide an excellent framework for the majority of the Bull Cycle’s trajectory:
* The 2015-2017 Bull Run was almost entirely within the 0.5 (dashed blue trend-line) and 1.0 (solid blue) Fibs, until it broke in the final month of the Bull Cycle to peak on the FibMA Multiple 7.
* The 2019-2021 Bull Run started off more aggressively as it was initially hyped by the Libra news but later corrected within the 1.5 (dashed black) and 2.0 (solid black) Fibs.
* The new Bull Run has started after the November (FTX crash) bottom and is now within the 2.5 (dashed orange) and 3.0 (solid orange) Fibs. This should technically by the new Channel Up for the new Bull Run.
It appears that each Bull Run is a whole 1.0 Fib level lower than the previous one. This is consistent with Bitcoin’s Theory of Diminishing returns over time.
Also all bottoms hit or came extremely close to the 1W MA350 (bold green line).
We can estimate in addition a rough 121 week (847 day) time range from the bottom of the Cycle to the Top of the top of the next one. This gives us a projection for the next Cycle Peak on March 2025.
As for what price the actual Top can hit? Moderate scenario the Multiple 5 (orange) and aggressive scenario the Multiple 7 (red).
Do you agree with the conclusions of this Pitchfork approach? Feel free to let us know in the comments section below!
Tradingview link: