

- February 8, 2023
- Posted by: Tradingshot Articles
- Category: Cryptocurrency
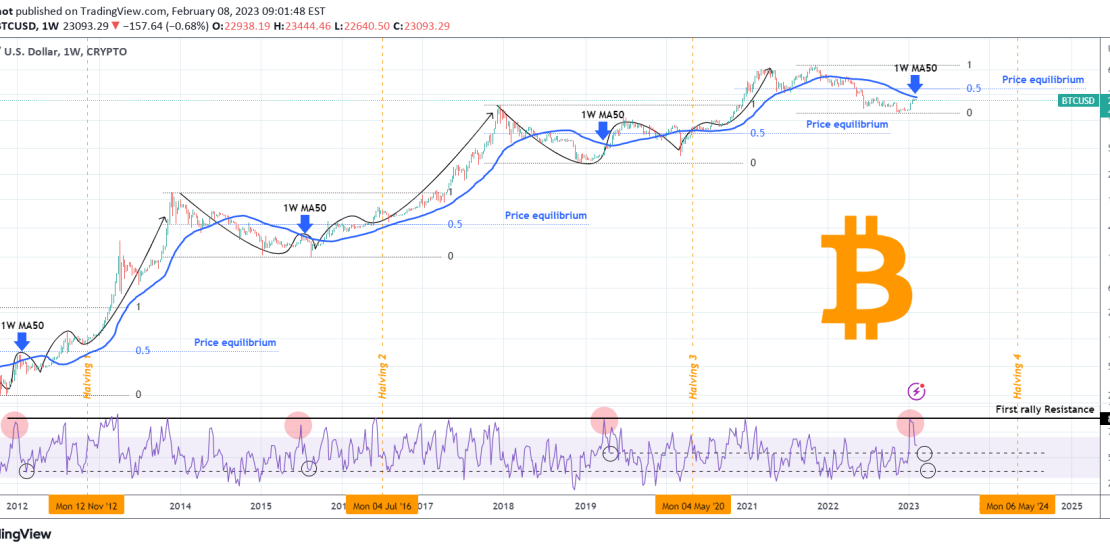
This is the 3rd week in a row that Bitcoin (BTCUSD) comes that close but struggles to break above the 1W MA50 (blue trend-line). Technically speaking that alone is a major Resistance. But if you check at the same time the start of all previous Bull Cycles, you will see that it was the ‘Resistance-to-beat’ during all.
More specifically during every new Bull Cycle, every time the price rebounded towards the 1W MA50 after a market bottom, it struggled there for a few weeks before it broke convincingly above it (exc Jan 2012 marginal break but still corrected for a few weeks before rising).
What’s more interesting is that this short-term weekly correction was achieved after an already massively overbought 1D RSI got rejected at (or near) the 88.00 ‘First Rally Resistance’. As you see this is what happened on all new Bull Cycle starts: April 01 2019, June 29 2015 and December 26 2011. And it is what just happened now.
The target after the 1W MA50 break-out has been the 0.5 Fibonacci retracement level, which we call ‘Price equilibrium’ and is sitting at $32650. Notice how each Cycle regardless of length or price range, tends to follow a similar wave structure. Will the 1D RSI turning 55.00 be a good enough level for you to buy as in 2019 or waiting for 37.00 as in the first two Cycles?
Feel free to let us know in the comments section below!
Tradingview link: