

- January 6, 2023
- Posted by: Tradingshot Articles
- Category: Cryptocurrency
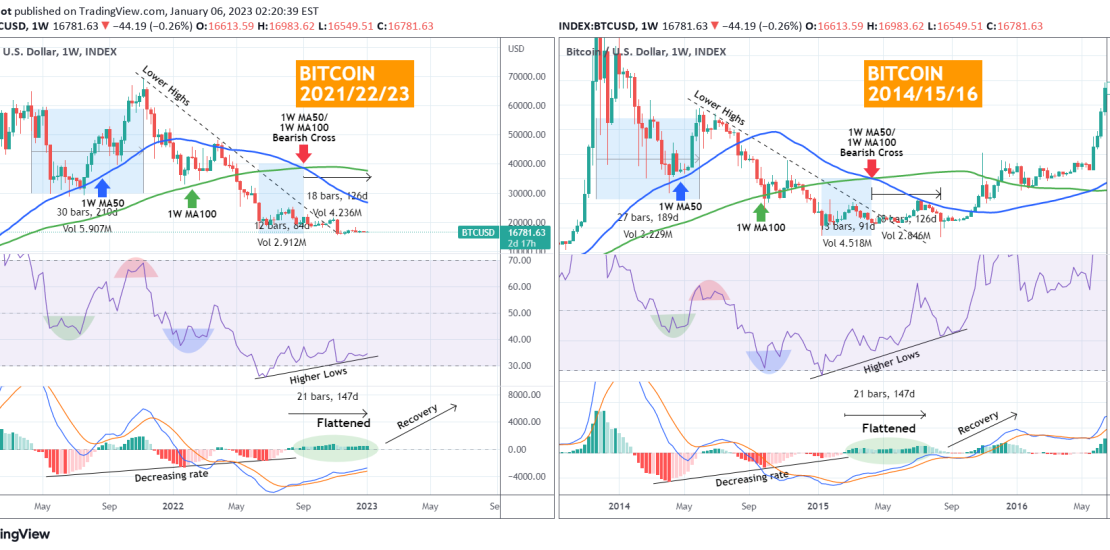
Bitcoin (BTCUSD) has been practically flat since the early November FTX crash, which was a big blow fundamentally for the market. On the 1W time-frame, this is not the first time though we see similar RSI and MACD behavior. On this chart we compare Bitcoin’s price action since the April 2021 High to the Bear Cycle of 2014/15.
** The true Cycle High **
As you see there are certain striking similarities. First of all, as we’ve mentioned numerous times on Tradingshot, BTC’s true technical top of the previous Bull Cycle was in April 2021. The October/ November 2021 rise was the extension at the peak of the tech bubble caused by trillions of 2020 rescue packages.
** Lower Highs, 1W MA50/100, RSI and MACD **
The first similarity is that the duration between each Cycle’s High 1 and High 2, which is where the Lower Highs trend-line (dashed) started, was 30 weeks in 2021 and 27 weeks in 2014. During that time, the 1W MA50 (blue trend-line) was supporting.
After the price broke below it, following the start of the Lower Highs trend-line, it hit the 1W MA100 (green trend-line). During that whole time, the 1W MACD was on a decreasing rate, as the red histogram shows, while the 1W RSI formed an identical print.
After a rejection on the Lower Highs trend-line, Bitcoin broke below the 1W MA100 and dropped significantly, forming the lowest RSI level. That started a Higher Lows (RSI) trend-line, which is holding to this day. At the same time the MACD has flattened.
It is also interesting to see that the duration from the RSI Low up until the Bearish Cross between the 1W MA50 and 1W MA100 was 12 weeks in 2022 and 13 weeks in 2015. Again almost perfect symmetry between the two fractals.
** Where are we today? **
Getting closer to today, this time BTC maintains a considerably distance from its 1W MA50 (roughly at 26700 now) that it was in May/ June 2015 after breaking above the Lower Highs (dashed) trend-line. A rejection on the 1W MA50 caused one last low before the recovery started with Bitcoin never looking back on Higher Highs and Higher Lows.
This time however the MACD is already near the same distance as in July 2015. The last low in August 2015 was 18 weeks after the 1W MA50/100 Bearish Cross. Today, we are on the 17th week since the September 05 2022 1W MA50/100 Bearish Cross.
Does this mean that the recovery is imminent? It looks like even with a few weeks of delay, Bitcoin may be close to starting the first rally of the next Bull Cycle and never look back.
Do you agree? Feel free to let me know in the comments section below!
Tradingview link: