- December 16, 2022
- Posted by: Tradingshot Articles
- Category: Forex

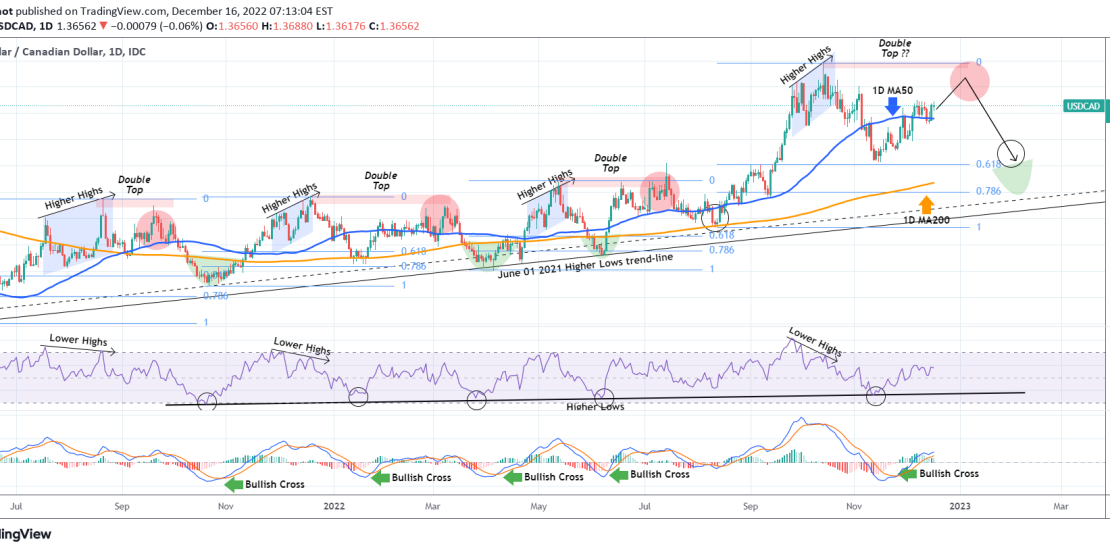
The USDCAD couldn’t have confirmed our bearish view two months ago, when we called for a sell opportunity based on the RSI Bearish Divergence (Lower Highs against the price’s Higher Highs):
As you see the divergence sell signal was spot on and the previous two times that this was spotted, helped us in a great way to spot this. Right now the price again above its 1D MA50 (blue trend-line) and based on the fractal, as long as it stays above the 1D MA50, it will approach the 1.39860 High. A Double Top there, will confirm all previous three sequences which got rejected on their previous High and hit at least the 1D MA200 (orange trend-line). The max extension on that pull-back is the 0.786 Fibonacci retracement level.
Notice how the RSI Higher Lows trend-line offers Support and the best buy entry in the past 12 months.
Tradingview link:
https://www.tradingview.com/chart/USDCAD/a7yokTKC-USDCAD-Resistance-test-and-then-Sell


