

- December 15, 2022
- Posted by: Tradingshot Articles
- Category: Forex
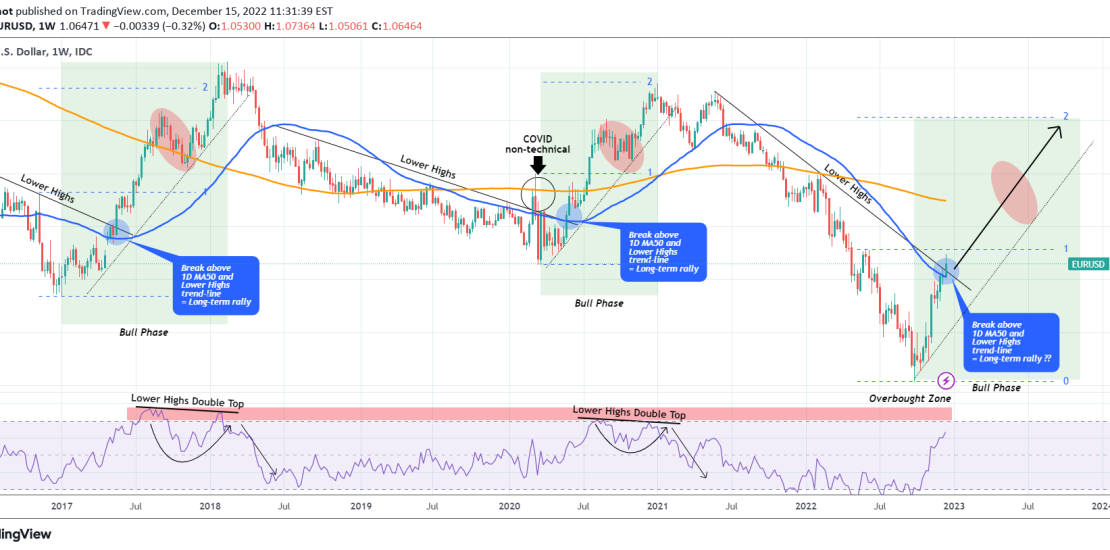
The EURUSD pair broke last week above the 1W MA50 (blue trend-line) and this week above the Lower Highs trend-line from the May 24 2021 market High. Last time the price was above the 1W MA50 was 18 months ago (on the week of June 21 2021!) and that alone constitutes a very strong buy signal for the long-term.
The previous two times that we saw the combination of 1W MA50 and Lower Highs of a downtrend break-out was on May 25 2020 and May 08 2017. In both historic cases, this break-out combination confirmed the end of the previous downtrend and the start of a new (roughly 2 year) Bull Phase. In both sequences, the rise reached as high as the 2.0 Fibonacci extension, counting from the last Lower High prior to the Lower High break-out. That new 2.0 Fib is now a little over 1.2000 and technically that should be the target of a Bull Phase that can last for at least another year.
Technically we shouldn’t see a major technical pull-back before the price breaks above the 1W MA200 (orange trend-line). In the previous two phases this is displayed by the red ellipse and dropped the price at least -3%. The end of the Bull Phase and price peak was made after the 1W RSI made a Lower Highs Double Top.
Long-term investors can take this 1W MA50/ Lower Highs break-out opportunity to buy the dips in 2023 and profit off of this pattern.
Tradingview link: