- November 21, 2022
- Posted by: Tradingshot Articles
- Category: Commodities

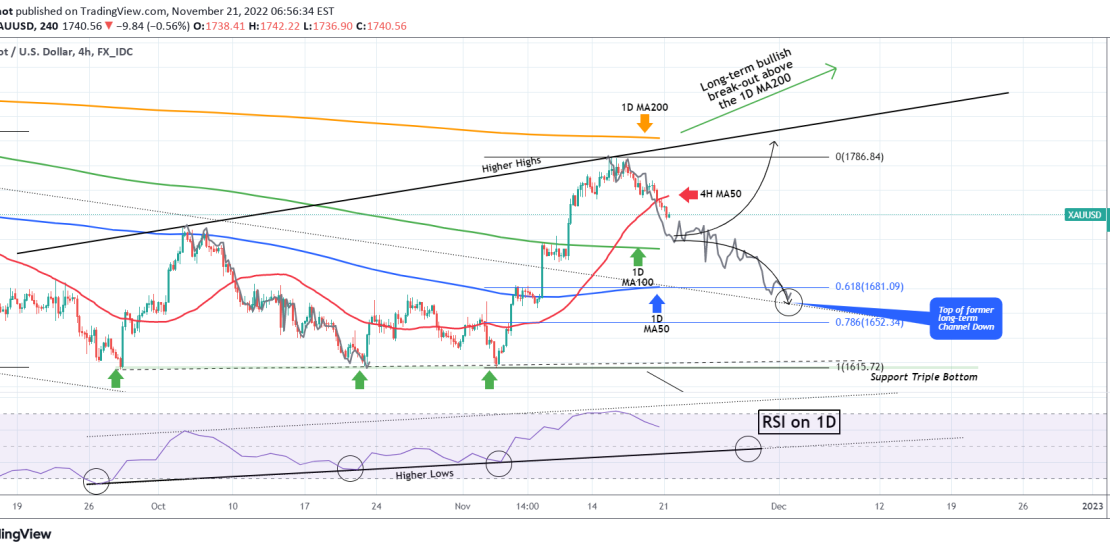
Gold (XAUUSD) broke below its 4H MA50 (red trend-line) on Friday for the first time since November 04, which was when the strong rally started on the Triple Bottom. Having failed to reach the 1D MA200 (orange trend-line), which is the long-term Resistance and difference maker between a long-term bullish and long-term bearish trend, this is most likely the start of a much needed technical pull-back.
The Support levels are the 1D MA100 (green trend-line) and 1D MA50 (blue trend-line). If this repeats the October 04 – October 21 Bearish Leg, then it could reach 1670 but looks unlikely as this is below not only the 1D MA50 and the 0.618 Fibonacci retracement level (1681).
Perhaps the best indicator to buy is when/ if the 1D RSI hits its Higher Lows trend-line from the September 26 Low. If the pull-back is discontinued and the price rises instead, then we will buy the break-out above the 4H MA50. The target in both cases is the 1D MA200.
Tradingview link:

