

- October 21, 2022
- Posted by: Tradingshot Articles
- Category: Forex
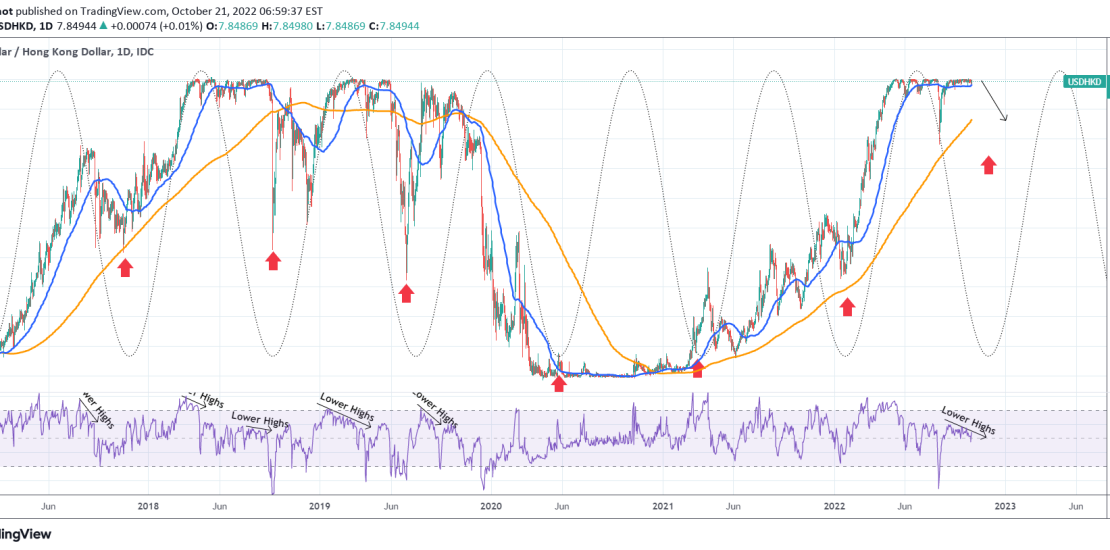
The USDHKD pair naturally has a tight trade but at times gets volatility shocks. A signal that since 2017 has triggered such shocks to the downside has been flashing on the 1D RSI.
As you see during that period, every time the 1D RSI formed Lower Highs while the candle action was either rising or flat, a strong drop occured. We have another 5 such occurrences. The price is right now on the multi-year Resistance level, supported by the 1D MA50 (blue trend-line) and the most likely target is the 1D MA200 (orange trend-line), which has been untouched since February 2021.
Notice also the nice flow provided by the Sine Waves that have fairly accurately caught major market lows since 2016. Such a low is next projected by this indicator for the last week of November. The timing seems perfect for a sell on the USDHKD pair.
Tradingview link:
https://www.tradingview.com/chart/USDHKD/xkaeWfLR-USDHKD-Drop-imminent-on-a-5-year-RSI-signal