

- October 10, 2022
- Posted by: Tradingshot Articles
- Category: Commodities
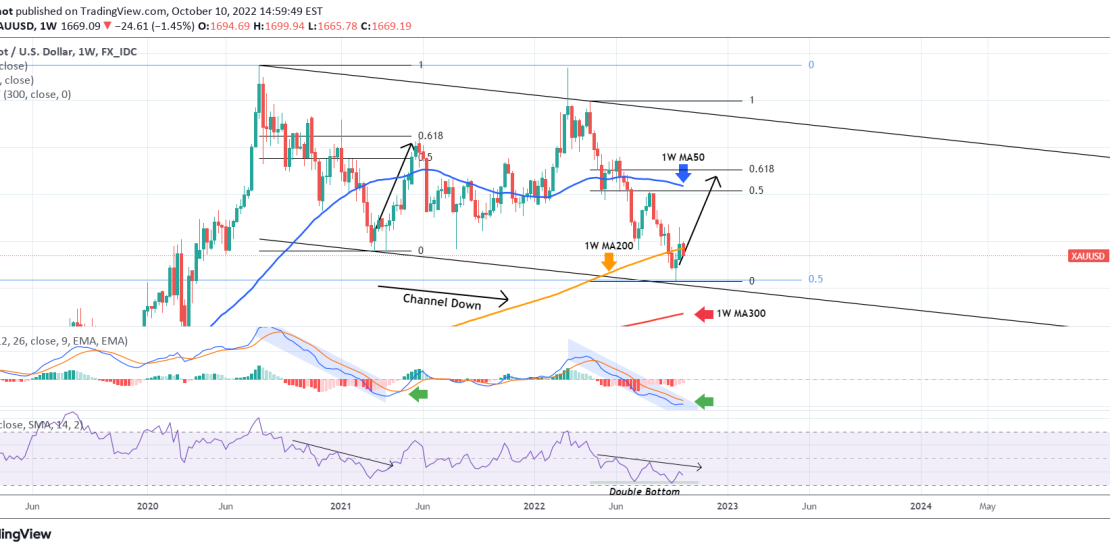
Gold (XAUUSD) closed last week above the 1W MA200 (orange trend-line) but so far it started this week with a heavy drop back below it. This analysis shows a potential long-term Channel Down pattern on the 1W time-frame, which can extend the rebound that started two weeks ago after the price nearly touched the bottom (Lower Lows trend-line) of the formation.
Basically so far in terms of both MACD and RSI, it resembles the bearish leg that formed the first Low of the Channel on the week of March 15 2021. Notice also that two weekly candles ago, the price also hit the 0.5 Fibonacci retracement level (High Aug 03 2020, Low Aug 13 2018). The previous Low rebound broke within the 0.5 – 0.618 Fib Zone from the prior High, also above the 1W MA50 (blue trend-line), which is now within 1807 – 1852.
As the long-term trend and the US10Y, DXY correlations weigh more towards a bearish Gold sentiment, it may be best to engage after a confirmation. And right now the best you can get would be when the 1W MACD makes a Bullish Cross (green arrow). Failure to do so, will break below the Channel and invalidate the pattern, in which case we can target the 1W MA300 (red trend-line).
Tradingview link:
https://www.tradingview.com/chart/XAUUSD/IrrKNTed-XAUUSD-Fierce-battle-on-the-1W-chart