

- September 19, 2022
- Posted by: Tradingshot Articles
- Category: Commodities
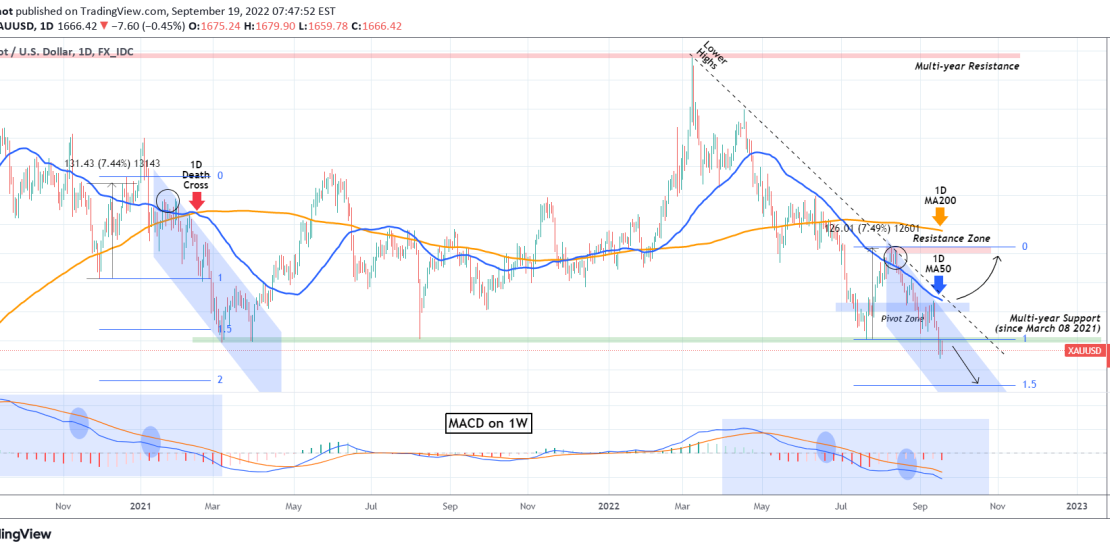
Gold (XAUUSD) broke the 1680 long-term Support level last Thursday, a level that has been holding since March 08 2021. As we mentioned last week, the continued rising bond yields are a main reason of this market breaking this psychological Support. On today’s analysis, we will focus on the 1D time-frame and how to trade the medium-term under the new dynamics.
First, the 1680 break came after a rejection on the 1D MA50 (blue trend-line), which technically adds up to the downtrend. This shows that the major market participants never intended to allow Gold to break upwards. In addition, we see the price today being rejected on the 1680 level, on its first test as a Resistance. On the short-term, this adds more weight to the selling side as it discourages dip buyers.
If the conditions don’t change, we expect a new bearish leg that can reach as low as the 1.5 Fibonacci extension on the medium-term, which is at 1618.50. We are modeling this out of the bearish sequence of mid-January 2021 – early March 2021, which as you see had a similar set of parameters: fake out above the 1D MA50 (circle), followed by an instant sell-off and a dead-cat-bounce that was rejected on the 1D MA50, which only gave way to the final 1.5 Fib flush. Notice how the MACD on the 1W time-frame between the current sequence and that of 2020/21 are similar.
On the other hand, a new break above the 1D MA50, will most likely not be a fake-out this time and since it will break above the Lower Highs trend-line of the March 08 2022 ‘Ukraine-Russia’ High, it should be enough to reverse the medium-term towards the 1808.50 Resistance.
Tradingview link:
https://www.tradingview.com/chart/XAUUSD/3kciGHVo-XAUUSD-Trading-plan-after-the-key-1680-break