

- September 17, 2022
- Posted by: Tradingshot Articles
- Category: Cryptocurrency
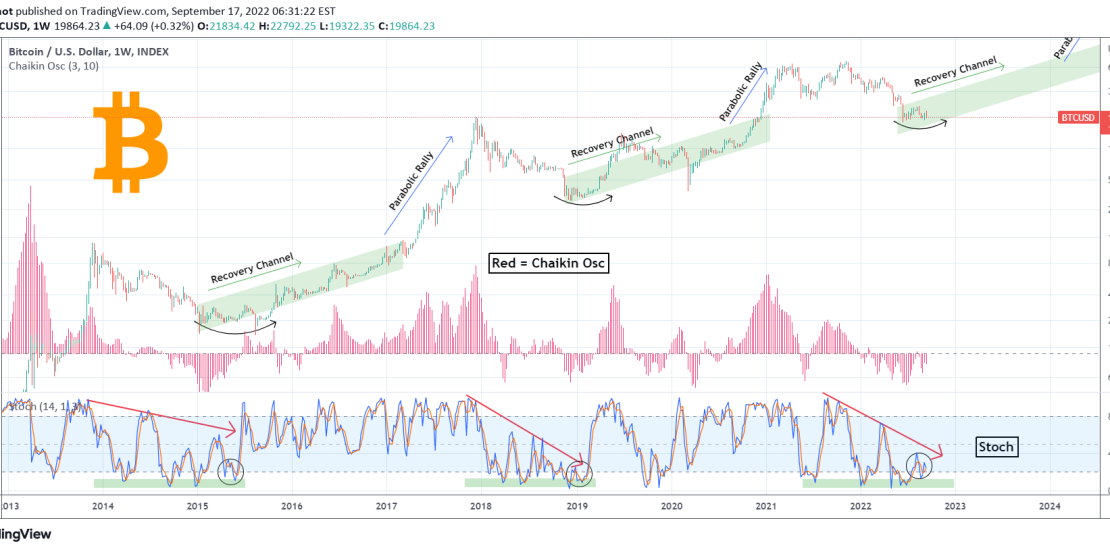
This is a Bitcoin (BTCUSD) analysis on the 1W time-frame using the Chaikin Oscillator and the Stochastic. It is not common to see those two indicators, especially on such an asset, but despite being overlooked, they offer an excellent explanation of where the price is trading relative to its previous Cycles.
** The Chaikin Oscillator **
The Chaikin Osc, which is displayed by the red histogram has been mostly trading below the 100.00 level since the start of the year (Jan 2022). We saw the same trading pattern during the late 2014/ early 2015 Cycle bottom formation and to a shorter extent during the November 2018 – March 2019 Cycle bottom formation. Observe how symmetrical the peaks (which made Lower Highs during the Bear Cycle) of the Chaikin are.
** The Stochastic **
Now take a look at the Stoch, which also forms Lower Highs during Bitcoin’s Bear Cycles, a pattern that is again consistent throughout the current Cycle. At the same time, there is a noticeable Support Zone. At the end of that zone, after the last Lower Highs, the Stoch prints a Higher Lows formation, quite volatile, which then aggressively breaks to the upside the breaks the 80.00 level. It appears that BTC is currently at this exact stage.
Every such Chaikin – Stoch combo in the past Cycles has always come after the Bottom and indicated that BTC was at the start of the recovery Channel (green), which slowly but methodically led the price to the previous All Time High that gave way to the Parabolic Rally that eventually ended the Cycle with the new High.
Do you agree with the above evidence. Has BTC entered the Bull Channel or we haven’t seen the Bottom yet? Feel free to share your work and let me know in the comments section below!
P.S. Because the chart having the Chaikin Osc plotted together with the BTC candles, it is not constant and may appear distorted based on your screen’s/ browser dimensions. The original looks like this below, so if yours doesn’t, adjust the vertical/ horizontal axis in order to make it look like this and better understand what is illustrated:
Tradingview link: