

- September 16, 2022
- Posted by: Tradingshot Articles
- Category: Cryptocurrency
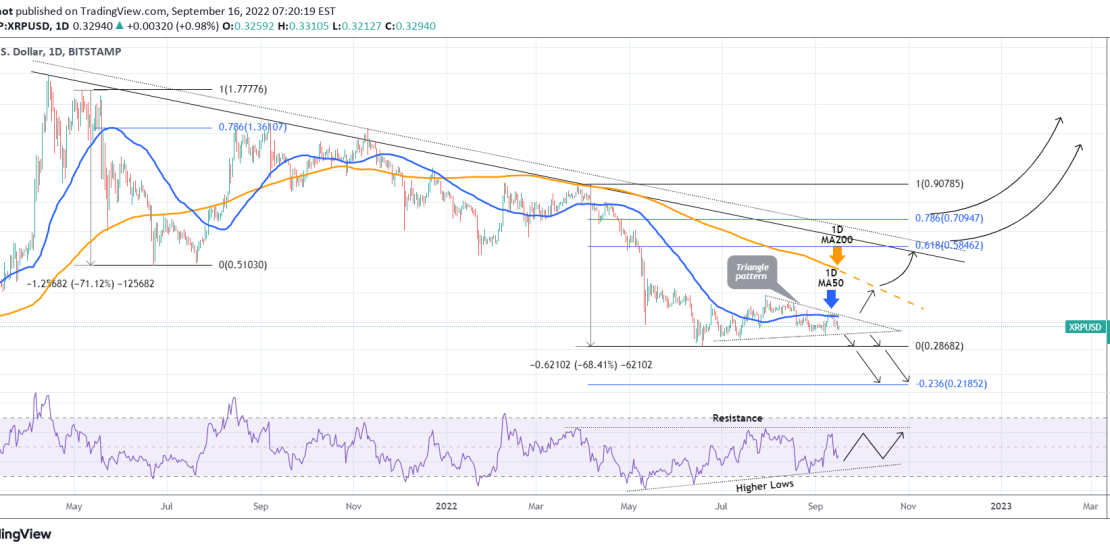
Ripple (XRPUSD) got rejected this Tuesday on the 1D MA50 (blue trend-line) in the aftermath of the worse than expected CPI report. That rejection was performed on the top (Lower Highs trend-line) of the Triangle pattern that the price has been trading in since the July 13 Low.
Naturally, as long as the price remains within the pattern, the trend remains neutral short-term, which is a solid scalping opportunity. A break below it, targets the 0.28680 Low of June 18, which is the current Support and further break can result into a new collapse on the -0.236 Fibonacci extension (0.21850).
On the other hand, if the Triangle breaks to the upside, it will be a bullish break-out signal, targeting the 1D MA200 (orange trend-line) on the medium-term. A new break there should chase after the Lower Highs zone from the April 2021 High.
The 1D RSI has been on Higher Lows since May 12, which slightly favors the bullish case but there is a clear Resistance as well to be mindful of.
Tradingview link: