

- July 27, 2022
- Posted by: Tradingshot Articles
- Category: Commodities
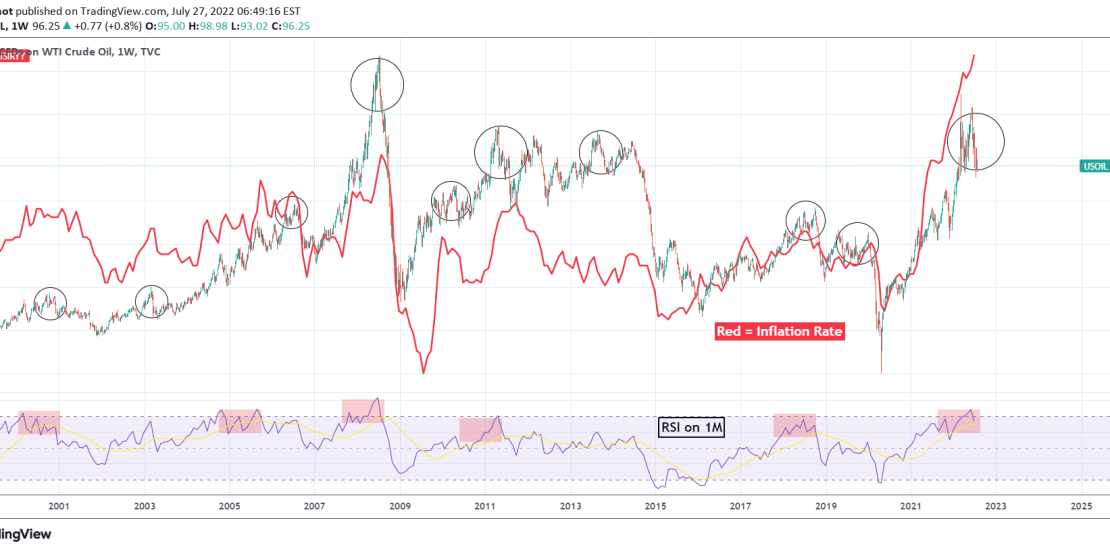
Another inflation (red trend-line) cross study, this time against the WTI Oil (USOIL). It is evident that the correlation between the two is very tight and every time the Oil market started forming a top pattern (circles), the Inflation Rate followed it lower shortly.
I will not get into much detail as the chart is pretty self-explanatory. Oil has been on Lower Highs and Lower Lows since the March “war” peak, which is a bearish formation and if it wasn’t for that “war” peak, the pattern would have been a Head and Shoulders, which is also a peak formation. With the 1M RSI back below the 70.00 overbought level after breaking above it for the first time since April 2011 and the only the 5th since 2000, it is more likely to have a market top on Oil. As a result, if a correction starts then Inflation which is still on Higher Highs lagging behind, is more likely to peak as well and finally correct back to sustainable levels in the coming months.
Tradingview link:
https://www.tradingview.com/chart/USOIL/GOEkWq87-OIL-showing-that-inflation-has-peaked