

- July 19, 2022
- Posted by: Tradingshot Articles
- Category: Forex
The EURUSD pair is making the expected rebound leg to a new Lower High within the year long Channel Down as we explained on our post 11 days ago:

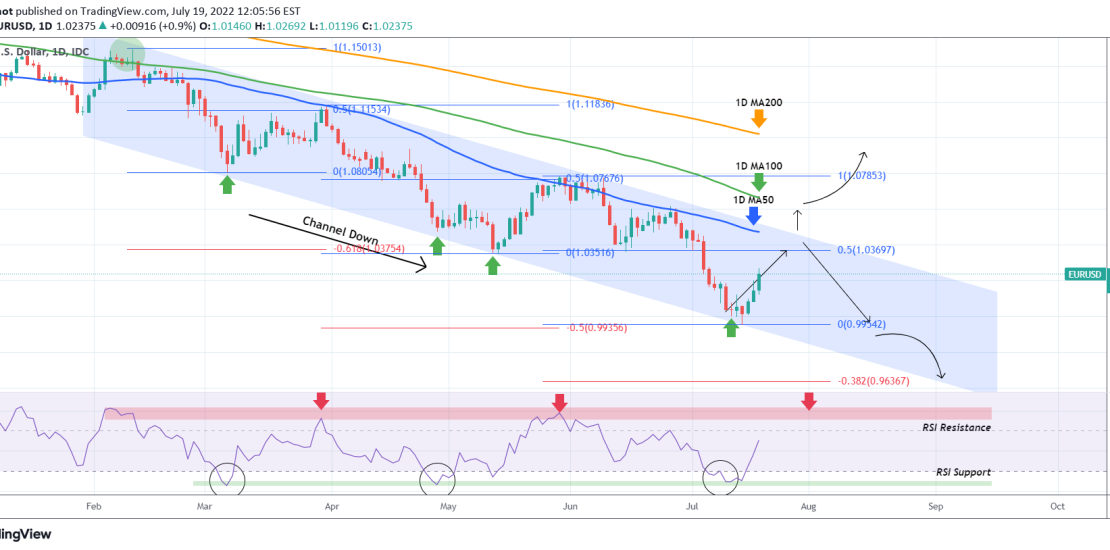
As shown, every Lower High since March 31 is formed on the 0.5 Fibonacci retracement level and the 1D MA50 (blue trend-line). That puts a limit on the current move within approximately 1.0370 – 1.04650. If you bought the bottom (Lower Low) as suggested, you may consider taking profits within this range or at least move the SL to a comfortable profit level. Naturally selling is favored next but with the SL positioned just over the top of the Channel Down, that makes the Risk/ Reward ratio very appealing.
If it fails and the price breaks above, the 1D MA100 (green trend-line) is the short-term target (which last time rejected the price on Feb 11) with the 1D MA200 (orange trend-line) being the long-term (untouched since June 17 2021!). That is the level to look for a bullish break-out if you want to catch a sustainable long-term reversal wave.
On the other hand if the sell is successful and the top of the Channel holds, the short-term target should be the last Low with the next Lower Low projected on the -0.382 Fibonacci extension (around 0.96370).
P.S. As mentioned on the previous analysis also, notice how well the RSI Resistance and Support Zones have been working for selling and buying on the Lower Highs and Lower Lows respectively within the Channel Down since February.
Tradingview link: