

- July 16, 2022
- Posted by: Tradingshot Articles
- Category: Cryptocurrency
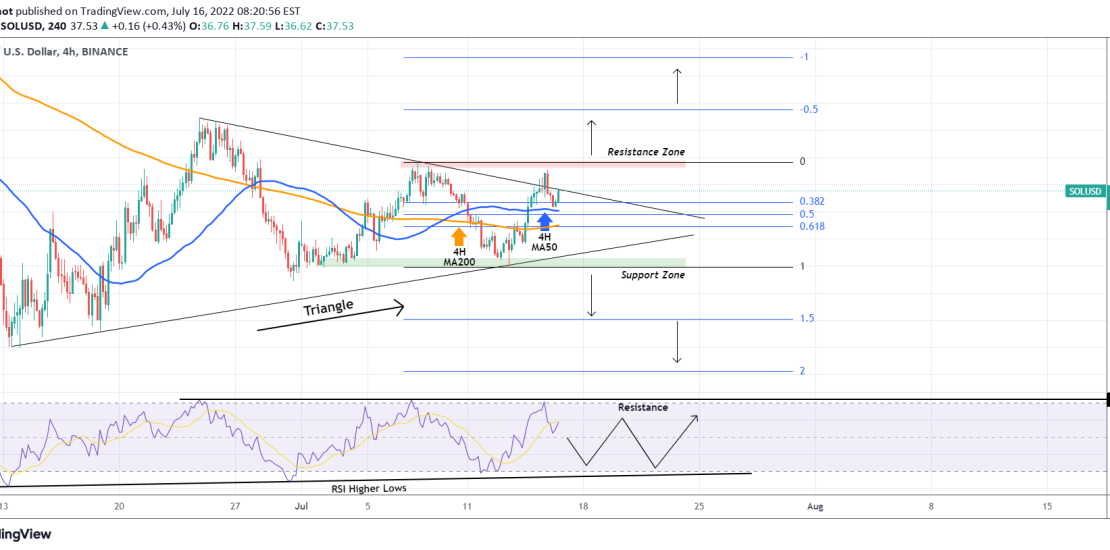
Solana (SOLUSD) broke yesterday above the Lower Highs (top) trend-line of the Triangle pattern that it has been trading in for the past 1 month. The pull-back that followed has been quicly contained today above the 4H MA50 (blue trend-line), which has established itself as Support, with the 4H MA200 (orange trend-line) being right below on the 0.618 Fibonacci retracement level.
Still, there is a clear Resistance and Support Zone to consider. As a result, it would be best to trade this on a break-out approach. A break above the Resistance targets the -0.5 and 1.0 Fibs in extension, while a break below the Support targets the 1.5 and 2.0 levels. The RSI Res and Higher Lows can also help us trade on the short-term within a range.
Tradingview link:
https://www.tradingview.com/chart/SOLUSD/zZ0d0jG9-SOLUSD-Broke-above-its-Triangle-Bullish-bias-ahead