

- July 13, 2022
- Posted by: Tradingshot Articles
- Category: Commodities
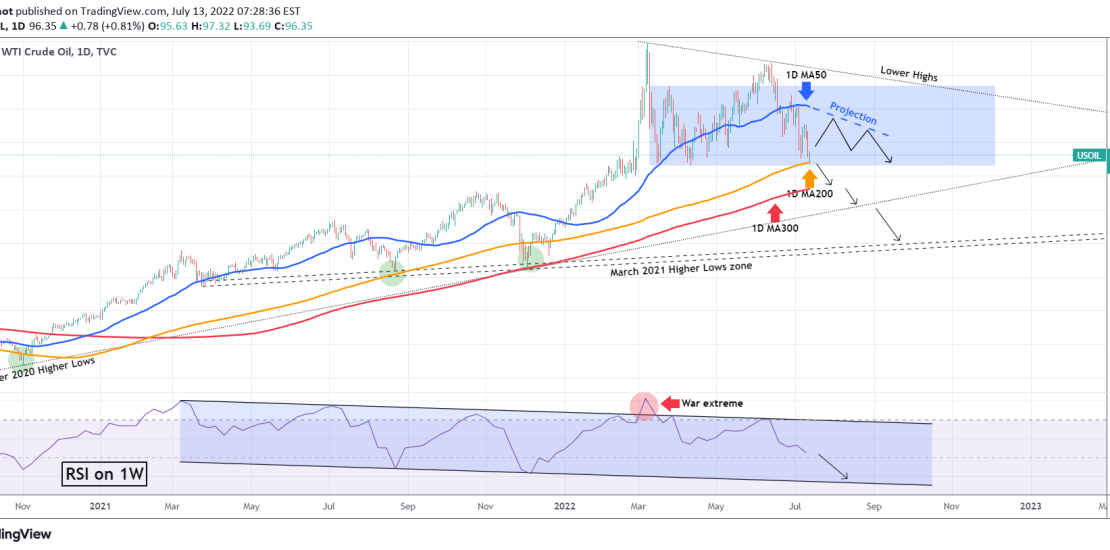
WTI Crude Oil (USOIL) touched today the 1D MA200 (orange trend-line) for the first time in 2022, more specifically since December 21 2021! This strong selling on the market has come after successive Lower Highs since June 14 and a rejection on the 1D MA50 (blue trend-line).
Since the March 08 market High, this may look as the start of a multi-year Bear Cycle but the fall isn’t that dramatic yet, as excluding the June 14 High, the market has been ranging sideways (high volatility nonetheless) within a Rectangle pattern since the March drop. This is a make or break moment for the pattern. A break below the Support and naturally the 1D MA200, should seek the 1D MA300 (red trend-line) which priced the markets last Low on December 02 2021, before the mega rally started. A rebound on the Support should test the 1D MA50 on the short-term at least as a Resistance.
The most important indicator on this chart though is the RSI, which is displayed on the 1W time-frame. As you see, there is a Channel Down pattern involved, which (with the exception of the March war extreme) has price all of WTI’s Highs and Lows since the March 08 2021 High! The best long-term buy on the market can be taken exactly on the Channel’s Lower Lows (bottom) trend-line, whether that’s on the 1D MA300 or one of the lower Higher Lows trend-lines involved.
Tradingview link: