

- July 12, 2022
- Posted by: Tradingshot Articles
- Category: Forex
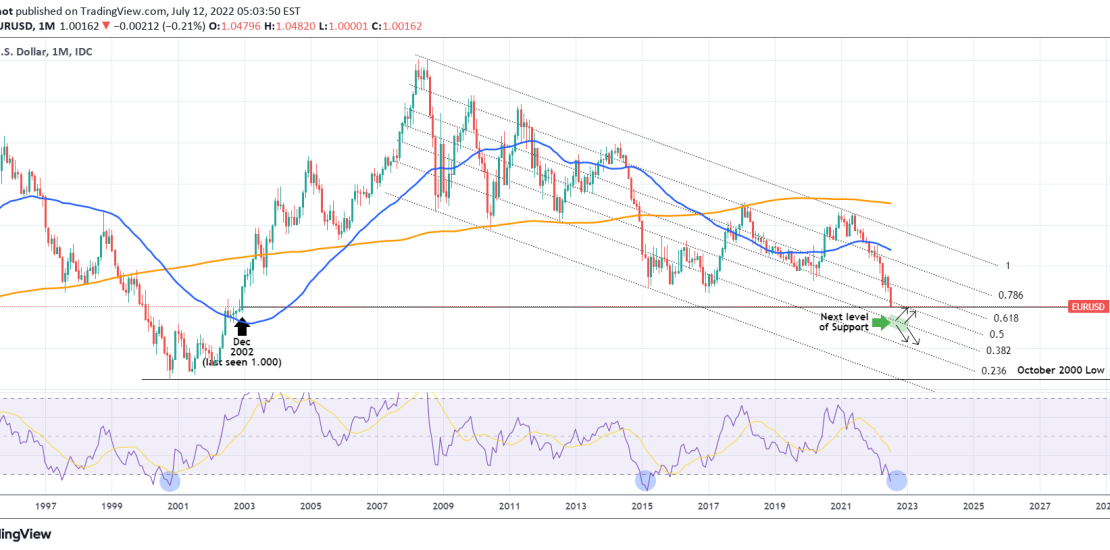
The EURUSD pair has finally hit today the 1.000 (parity) level, a feat last seen on December 2002! This 20 year span is regarded by many as the closing of a Cycle, however, there is a pattern involved that we shouldn’t disregard. That is the Channel Down starting after the July 2008 High (amid the Subprime mortgage crisis in the U.S.) with perfect matching Highs and Lows ever since. This is best viewed on this 1M (monthly) chart.
As you see, the application of the Fibonacci retracement zones, gives a new perspective of how well they’ve been acting as Supports during the previous downtrends. This shows that if the psychological barrier of 1.000 breaks (by that we mean a full 1M candle closing below it), then the next Support is seen on the 0.382 Fibonacci (green shape). What is even more interesting is that during this 14 year span, this Fib level only held once (Jan 2012) and that only marginally (new Lower Low made 6 months after). As a result, the 0.236 is more likely to come by the end of the year/ start of next, if the 1.000 Support fails to contain this 1 year correction.
Note that the 1M RSI hasn’t been that oversold since March 2015.
Tradingview link: