

- July 11, 2022
- Posted by: Tradingshot Articles
- Category: Cryptocurrency
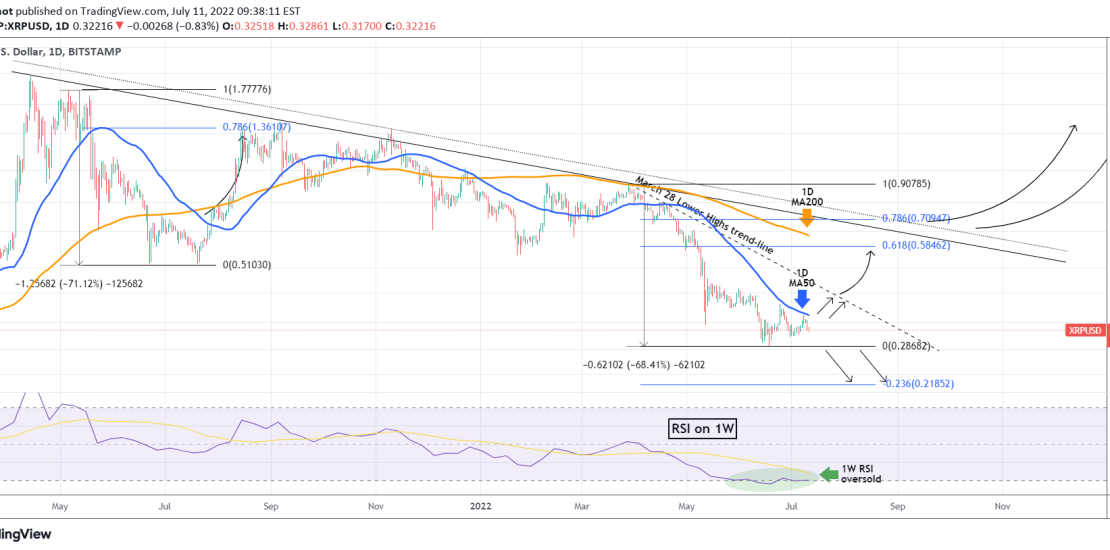
XRPUSD made its last Low on June 18 and since then attempted a rebound. So far this has been rejected twice on the 1D MA50 (blue trend-line), below which XRP has been trading since April 15. Even in the event of a break-out, there is still the March 28 Lower Highs trend-line to consider, breaking of which should be the strong medium-term buy signal towards the 1D MA200 (orange trend-line) and the 0.618 Fibonacci retracement level. After all the drop since March seems quite similar to the one in May 2021.
The 1W RSI may be oversold but a break below the 0.28680 low would be an automatic sell signal towards the -0.236 Fibonacci extension at around 0.21850.
Tradingview link:
https://www.tradingview.com/chart/XRPUSD/8XQTNlbN-XRPUSD-Failed-twice-on-the-1D-MA50-Action-plan