

- July 9, 2022
- Posted by: Tradingshot Articles
- Category: Cryptocurrency
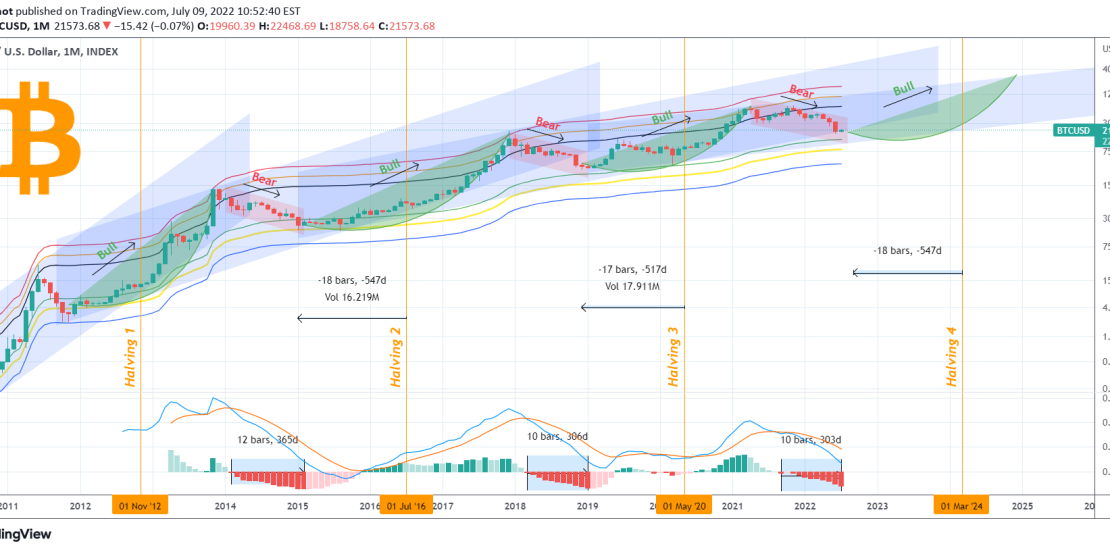
This is an analysis of Bitcoin (BTCUSD) on the 1M (monthly) time-frame where its long-term (historic) Cycles are best viewed. This is a combination of some previous studies of mine with adding the element of Cycle Channels instead of the Parabolic Growth Curve.
** The LMACD **
As you see those also effectively depict the notion of decreasing volatility and diminishing returns over time, which is a natural consequence of increasing adoption. This is also illustrated by the LMACD indicator (bottom pane), which shows slowing volatility and right now has completed 10 months in the red. During the previous Cycles, it recorded 10 and 12 months during the 2018 and 2014 Bear Cycles respectively before BTC formed the bottom. This shows that the bottom is either already in or should be priced by September.
** The Halvings **
Another factor that completely matches that date is the pre Halving nature of Bitcoin that during the previous two events, bottomed 17 and 18 months respectively for Halving 2020 and 2016. The next Halving (no 4) is expected for March 2024 and 18 months before the event, place the bottom this September as well.
** The MA Fibonacci multiples **
The added element of the MA multiples on this chart, gives a fresh idea of the huge Support offered by the 1.62X multiple (green line). Each Cycle though has found Support a Fib level higher each time. M21 (red trend-line) and M13 (orange trend-line), are the candidate levels for the Top of the upcoming Bull Cycle. That is currently within 107k and 173k approximately.
Do you also think the new Bull Cycle is closer than most expect? Feel free to share your work and let me know in the comments section below!
Tradingview link: