

- June 13, 2022
- Posted by: Tradingshot Articles
- Category: Commodities
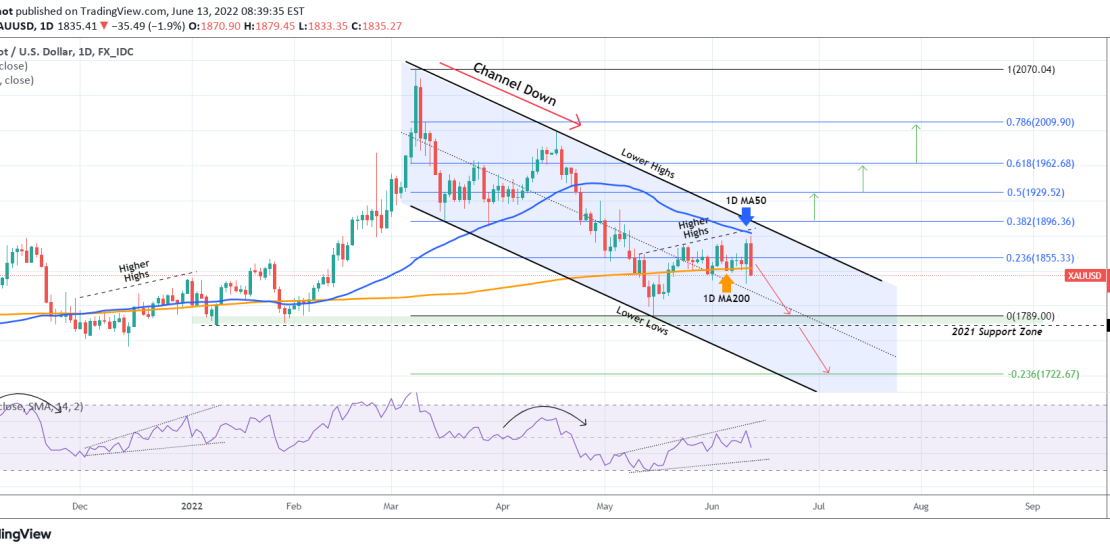
A lot of volatility lately on Gold (XAUUSD) with the inflation data weighing on the technically bearish long-term pattern, which as we outlined last week was a Channel Down:

As you see, the price got indeed rejected on the 1D MA50 (blue trend-line on the current chart, red on the previous analysis), which is just below the top (Lower Highs trend-line) of the Channel Down. Naturally, the price is heavily bearish, trending towards the 1789 Support, i.e. the May 16 Low, as it broke below the 1D MA200 (orange trend-line). Still, there seems to be a strong medium-term Support around the 1D MA200. So best to do is trade upon confirmation, i.e. bearish continuation with a sell trade if the 1778 bottom of the 2021 Support Zone breaks (target the -0.236 Fibonacci extension as a Lower Low) and buy if the price closes above the 1D MA50, or even better above the 0.382 Fib (target progressively the higher Fibonacci levels).
Tradingview link:
https://www.tradingview.com/chart/XAUUSD/rXHSU67T-XAUUSD-Still-bearish-unless-the-1D-MA50-breaks