

- May 27, 2022
- Posted by: Tradingshot Articles
- Category: Cryptocurrency
*** ***
For this particular analysis on TEZOS we are using the XTZUSDT symbol on the Phemex exchange.
*** ***
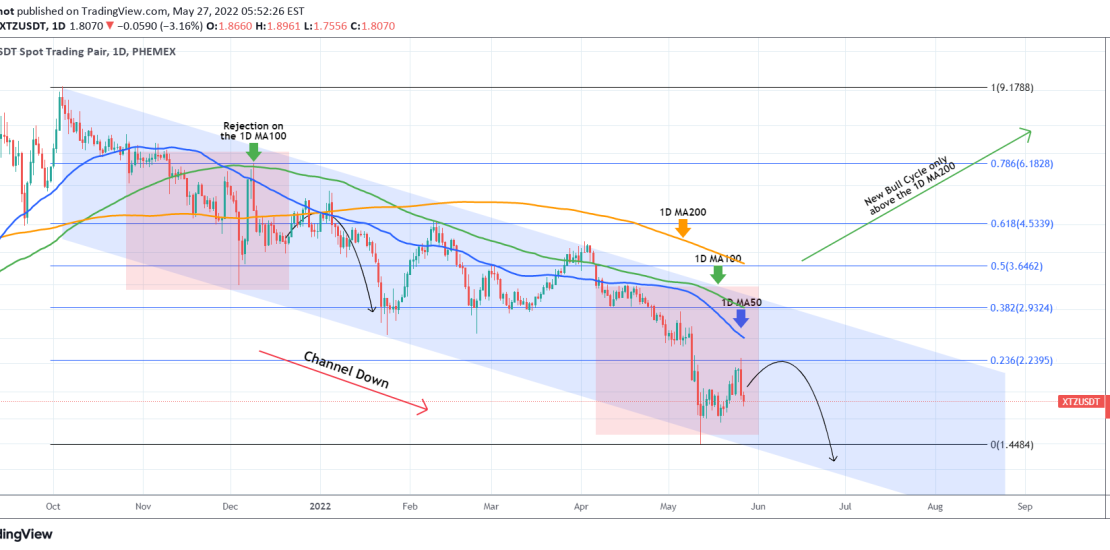
The idea is on the 1D time-frame where Tezos is shown trading within a Channel Down on the log scale. It has been trading below the 1D MA50 (blue trend-line) since April 07 and despite the May 12 rebound on the Lower Lows trend-line of the Channel, the price still got rejected on the 0.236 Fibonacci retracement level. Those Fibonacci levels have acted as Support/ Resistance levels since the October 2021 High, so this rejection keeps the trend bearish.
Practically, with the price action below the 1D MA50 resembling the sequence of November – mid December 2021, we can claim that only a 1D candle closing above the 1D MA100 (green trend-line) would reverse this bearish trend. That however happened in late March and still Tezos failed to establish a bullish reversal, so it is much safer to wait until the 1D MA200 (orange trend-line) breaks before calling a new Bull Cycle. Until then, it is more likely for the price to keep making Lower Lows.
Tradingview link:
https://www.tradingview.com/chart/XTZUSDT/j8Lq6HWW-XTZUSDT-Still-bearish-unless-the-1D-MA200-breaks