

- May 26, 2022
- Posted by: Tradingshot Articles
- Category: Forex
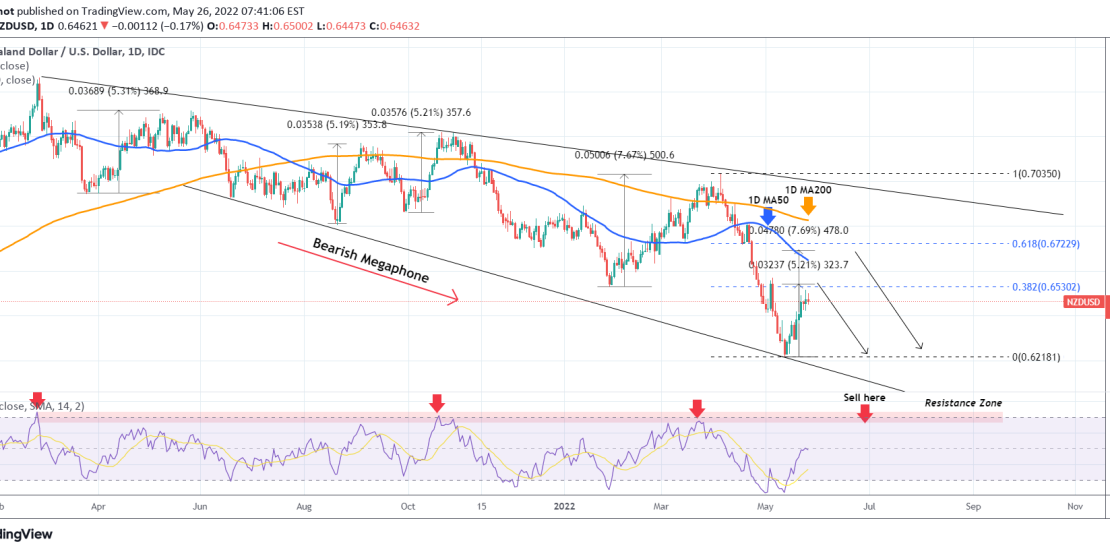
The NZDUSD pair has been trading inside a one year pattern that resembles a Bearish Megaphone. Below you can see the most recent trade on the pair:

Recently on May 12, the price made a Lower Low and has been rebounding since. As you see within this pattern, a common characteristic of all rebounds but one is that they have been just over +5.00%. Exception is the one in February that rose by roughly +7.70%.
The current rebound is almost at +5.20% and taking into account that this is where the 0.382 Fibonacci retracement level is as well as the May 05 High (and current Resistance) of 0.65680, makes it a strong candidate for rejection.
However, the RSI is still only at 49.50 and the Lower Highs Sell Zone is way above (67.50 – 73.00). Even the April 2021 rebound reached the 63.75 1D RSI level before turning sideways and eventually getting rejected.
As a result, dedicate only a small portion for selling here, most should be done after a +7.70%, roughly at 0.6670, which is also marginally below the 0.618 Fibonacci retracement level and by the time where the 1D MA200 (orange trend-line) is likely to be.
Tradingview link:
https://www.tradingview.com/chart/NZDUSD/NAPmy4nH-NZDUSD-Wait-for-these-levels-to-sell