

- April 22, 2021
- Posted by: Tradingshot Articles
- Category: Cryptocurrency
Back in January 05 (2021) I posted the following idea that (understandably to some extent) was received with some skepticism by the trading community:

** The Fibonacci Channel and the 1.0 Fib lower rule **
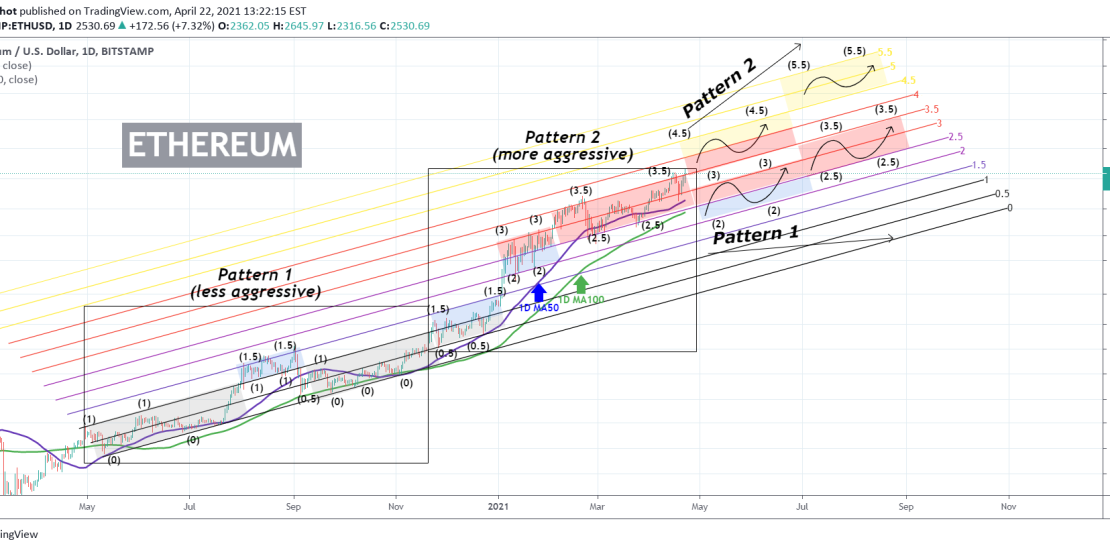
As you see the $1900 target was achieved even before my March deadline, but the most impressive thing is how Ethereum managed to trade so accurately in the Red Rectangle of February – April. The fundamental idea of this study was that ETHUSD is trading on a Fibonacci Channel (Up) which “follows a very specific sequence since May 2020. When a new Fib line High is made, the price pulls back 1.0 Fib below. The Fib zones are quite clearly displayed on the chart. When ETH hit 1.0 Fib it pulled back to 0.0. When it hit 1.5, it pulled back to 0.5. This was repeated several times from May until December 2020, long enough to be considered consistent.”
The pattern was confirmed once more (even though the first part was more aggressive than expected) as the price made a new High on the 3.0 Fibonacci extension and dropped 1.0 Fib lower for a Higher Low on the 2.0 Fib. That lasted until early February when the price made a new Higher High on the 3.5 Fib ext and again pulled-back 1.0 Fib lower to form the new Higher Low on the 2.5 Fib ext.
** What’s next? Pattern 1 and Pattern 2 projections **
Well if this pattern is extended (and since it has been valid and in effect for 1 year there’s no reason to expect it not to), then we should wait and see where the new High is made. Will it be on 4.5, following the more aggressive price action that the more recent Pattern 2 (from Nov 20 until now) displayed or will the price make a Lower High on the 3.0 Fib, following a less aggressive model similar to Pattern 1 (May 01 to Nov 20, 2020)?
** The role of the 1D MA100 **
In my opinion there are slightly fewer chances for a Pattern 1 projection to be realized as this would mean that the 1D MA100 (green trend-line) will break, when this trend-line has been supporting since this aggressive Fibonacci Channel started back in April 2020.
But what do you think? Will ETH follow a Pattern 1 projection and peak around $4000 by August or it will go for the more aggressive Pattern 2 and peak around $7000? Feel free to share your work and let me know in the comments section!
Tradingview link: