

- April 5, 2021
- Posted by: Tradingshot Articles
- Category: Cryptocurrency
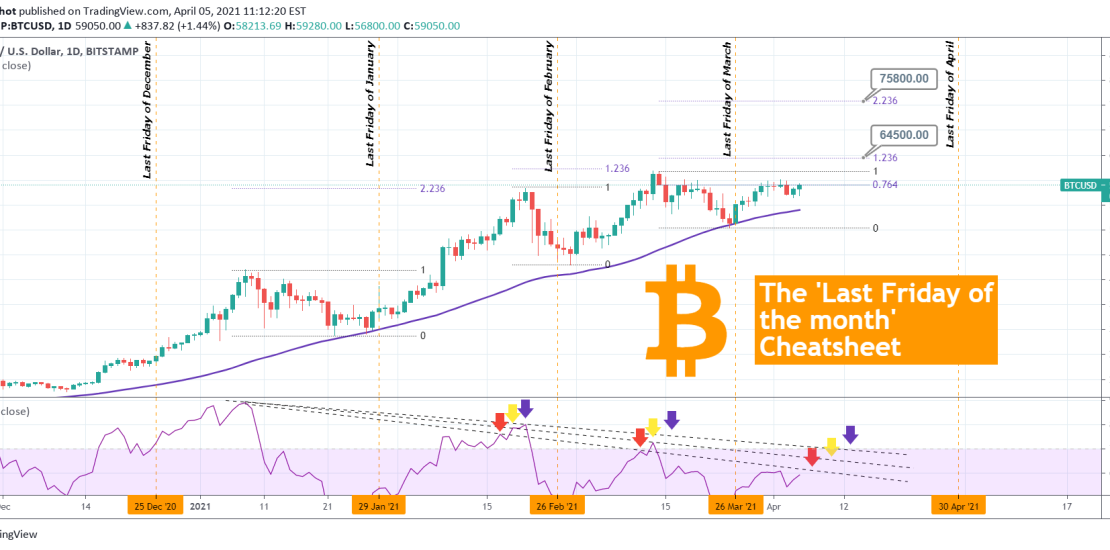
We all know that BTC options expire on the last Friday of every month. See on this chart how this has been consistent with Bitcoin’s every major rise since December, being around the bottom of every of those mini-phases.
The first Top was on the 2.236 Fibonacci extension from the bottom. The second was on the 1.236 Fib. Since we are past the danger of that turning bearish as the 0.764 Fib broke (1 minus 0.236), then the next top (third) according to the model should be either on the 1.236 Fib (which is at $64500) or on the 2.236 Fib (which is at $75800).
The RSI may be an additional tool for us to identify the next top with the help of the Lower Highs trend-lines (dashed) starting from the January 08 High. Notice also that with the exception of the January mini-cycle, the other two have made their tops closer to the month’s last Friday.
So where do you think the High of April will be at?
Feel free to share your work and let me know in the comments section!
Please like, subscribe and share your ideas and charts with the community!
——————————————————————————————————–
!! Donations via TradingView coins also help me a great deal at posting more free trading content and signals here !!
🎉 👍 Shout-out to TradingShot’s 💰 top TradingView Coin donor 💰 this week ==> xBTala
Tradingview link:
https://www.tradingview.com/chart/BTCUSD/uYEms9i3-BITCOIN-The-Last-Friday-of-the-month-effect