

- March 30, 2021
- Posted by: Tradingshot Articles
- Category: Forex
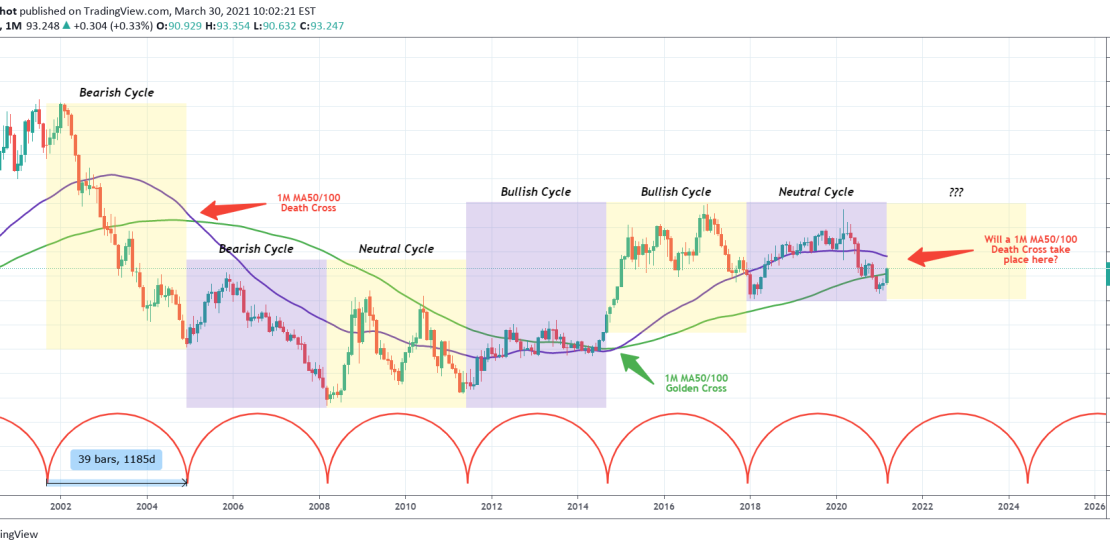
This month’s very bullish candle for the U.S. Dollar Index (DXY) is a transition one as it marks the end of the previous 3 year Cycle and the start of a new one. The previous Cycle was basically a neutral one, and it remains to be seen whether the current will be Bearish or Bullish.
The chart is pretty self-explanatory and as you see each Cycle is approximately 39 months in duration. This is a very consistent categorization which is holding very well since late 2001. What can make a difference right now as to what trend the new Cycle will follow, are the 1M MA50 (blue trend-line) and 1M MA100 (green trend-line).
After the 1st Cycle, those two formed a Death Cross (the 1M MA50 crossed below the 1M MA100) and the Cycle that followed was Bearish (ended with a Lower Low). Similarly after the 4th Cycle, a Golden Cross was formed (the 1M MA50 crossed above the 1M MA100) making the Cycle that followed a Bullish one (ended with a Higher High).
Right now we are getting closer to a new Death Cross. Will that mean that the new 3 year Cycle on the USD will be Bearish?
** Please support this idea with your likes and comments, it is the best way to keep it relevant and support me. **
——————————————————————————————————–
!! Donations via TradingView coins also help me a great deal at posting more free trading content and signals here !!
🎉 👍 Shout-out to TradingShot’s 💰 top TradingView Coin donor 💰 this week ==> xBTala
Tradingview link: