

- March 22, 2021
- Posted by: Tradingshot Articles
- Category: Cryptocurrency
Very quick update on a Bitcoin fractal I found.
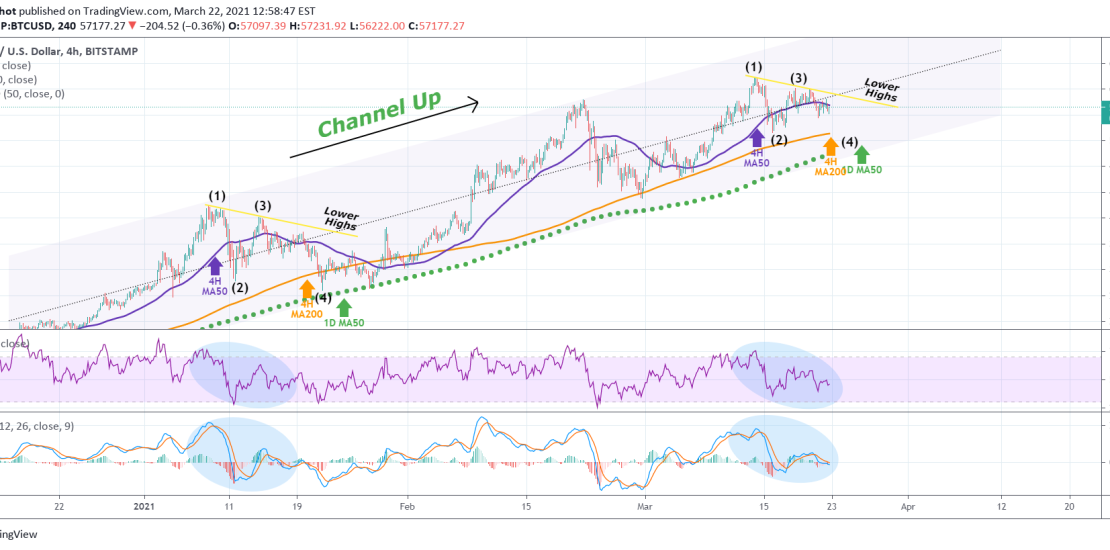
As you see on the chart the pattern since the March 14th High (which is so far a Triangle), is similar to the price sequence from the January 08 High to (so far) January 17. That sequence used the 4H MA50 (blue trend-line) for consolidation means and the broke further downwards to even break the 4H MA200 (orange trend-line) before it hit the 1D MA50 (green dotted line) and started to rebound.
The MACD and RSI formations between the two fractals are identical. If the January pattern is repeated then BTC has a potential bottom within 52000 – 50000 (leg (4)). Do you think that’s the case? Will however a break above the Lower Highs (yellow line) invalidate the fractal?
Feel free to share your work and let me know in the comments section!
Please like, subscribe and share your ideas and charts with the community!
——————————————————————————————————–
!! Donations via TradingView coins also help me a great deal at posting more free trading content and signals here !!
🎉 👍 Shout-out to TradingShot’s 💰 top TradingView Coin donor 💰 this week ==> jsunde73
Tradingview link:
https://www.tradingview.com/chart/BTCUSD/PQgv5NMi-BITCOIN-Is-this-fractal-the-way-to-go