

- February 25, 2021
- Posted by: Tradingshot Articles
- Category: Forex
Not much of an analysis, more of a post to debate and food for thought.
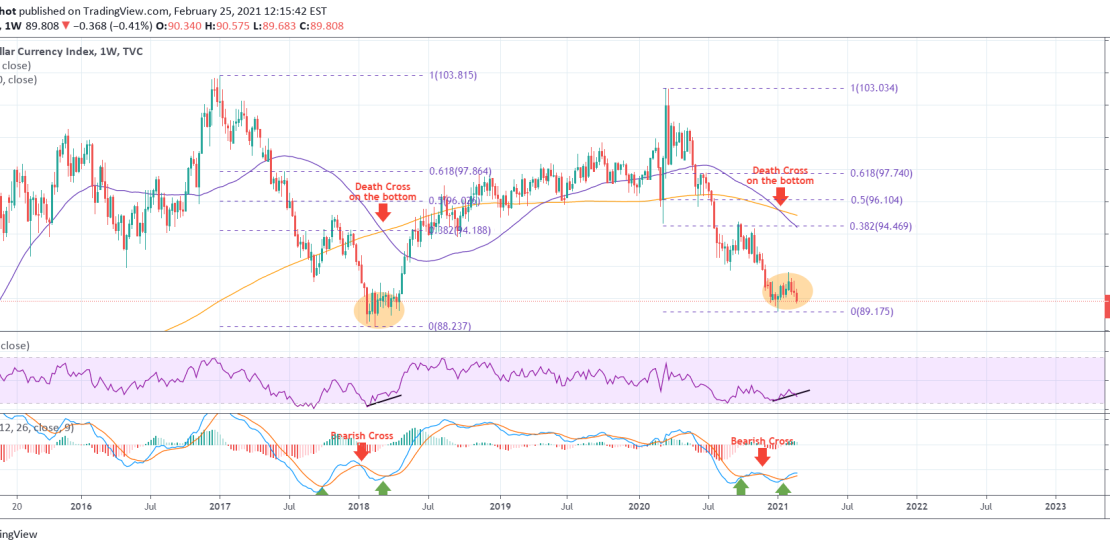
As you see the current price action on the 1W time-frame since January appears to be forming a bottom similar to that of January – March 2018.
The similarities are that both Bottoms came after a 1D Death Cross (MA50 (blue trend-line) crossing below the MA200 (orange trend-line)). The 1W MACD Bullish (green arrows) and Bearish (red arrows) Crosses are also on an identical sequence.
On the flip-side however, the current red 1W candle is proportionally much lower than any that followed the 2018 Bottom. As a result that causes the RSI to break its (minor) Higher Lows line.
Fundamentally 2018 didn’t have multi trillion USD packages inserted into the economy to save it from the COVID pandemic, as those we’re having post March. So will the upcoming new stimulus vote alter these multi-year symmetrical patterns, or history will repeat itself?
Recent short-term DXY signal:

** Please support this idea with your likes and comments, it is the best way to keep it relevant and support me. **
——————————————————————————————————–
!! Donations via TradingView coins also help me a great deal at posting more free trading content and signals here !!
🎉 👍 Shout-out to TradingShot’s 💰 top TradingView Coin donor 💰 this week ==> SocialCryptopreneur
Tradingview link:
https://www.tradingview.com/chart/DXY/VZpMoJN0-DOLLAR-INDEX-Will-history-repeat-itself/