

- January 12, 2021
- Posted by: Tradingshot Articles
- Category: Commodities
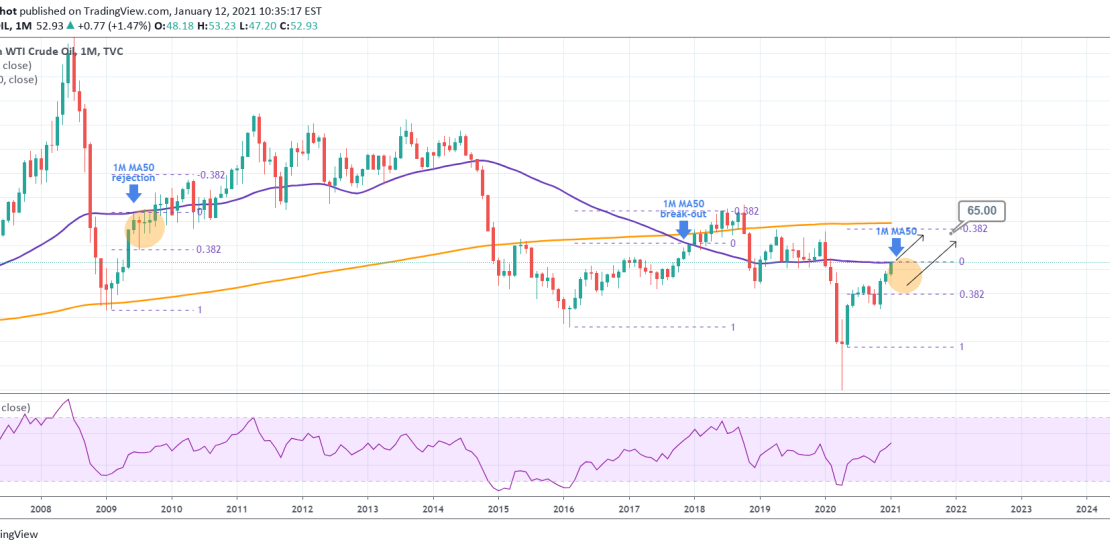
Last time this level was tested as a Resistance, recovering from a similar melt-down, was in December 2017. The price easily broke above it on the next candle and made a top on the -0.382 Fibonacci extension.
Before that, the previous 1M MA50 test as a Resistance, was in June 2009. It failed to close the monthly candle above it and pulled back to the 0.382 Fibonnaci retracement level. Then a few months later, it closed its first candle above it (October 2009) and as in 2018, it peaked just below the -0.382 Fib extension.
What could this mean for oil traders? Well unless we close one 1M candle above the MA50 (53.00), then it is more likely to get a pull back to the 0.382 Fibonacci retracement level (40.00) before the price peaks on the -0.382 extension (65.00).
Do you agree? Feel free to share your work and let me know in the comments section!
Most recent WTI signal:

Please like, subscribe and share your ideas and charts with the community!
——————————————————————————————————–
!! Donations via TradingView coins also help me a great deal at posting more free trading content and signals here !!
🎉 👍 Shout-out to TradingShot’s 💰 top TradingView Coin donor 💰 this week ==> ProjectSyndicate
——————————————————————————————————–