- January 1, 2021
- Posted by: Tradingshot Articles
- Category: Cryptocurrency

First of all allow me to wish everyone a Happy New Year! This community is and has been more than great this past year and even though we are all here for trading/ investing, let me wish everyone above all good health and prosperity.
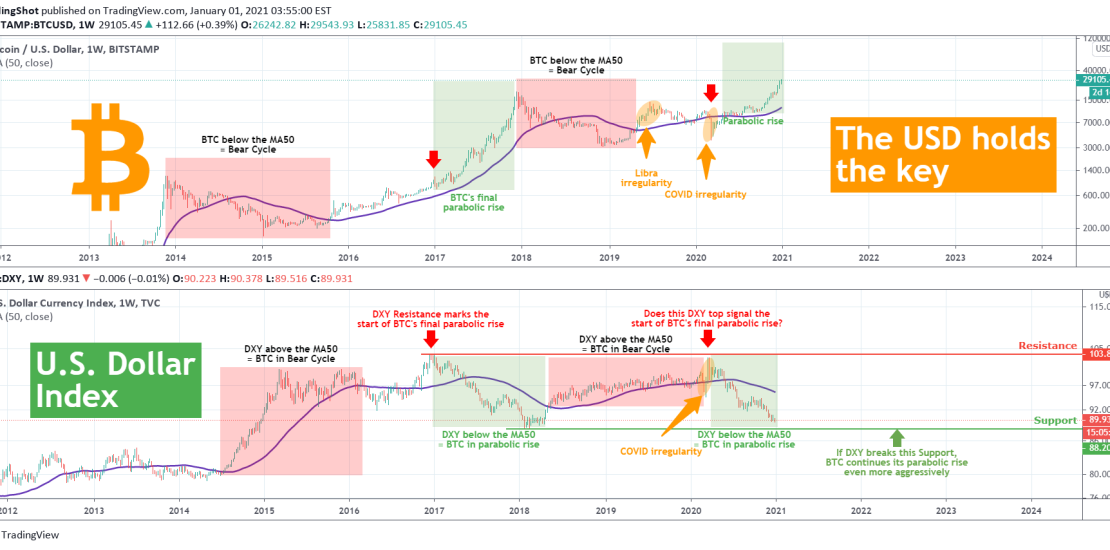
Now back to trading and Bitcoin in particular. This study is a cross examination of BTC’s cyclical phases in relation to DXY’s (the U.S. Dollar Index).
** DXY’s Resistance/ Support role **
As see on the lower chart, the DXY has a clear multi-year Resistance (103.800) and Support (88.200). Everytime DXY hit the Resistance and dropped to the Support, it coincided with a parabolic rise on Bitcoin (upper chart). In 2017 that was BTC’s final parabolic run. In 2020, after the shock that markets globally had to normalize, it is (so far) a very aggressive parabolic run that has just since November delivered over 200% gains.
** The 1W MA50 role **
We also see on the two charts (both on the 1W time-frame of course) that the 1W MA50 (blue trend-line) plays an important part on Bitcoin’s cyclical phases. As you see on DXY’s (lower) chart, every time the price is above its 1W MA50, it coincided with Bitcoin (upper chart) mostly trading below its own 1W MA50, practically its Bear Cycle. Similarly when DXY is below its 1W MA50, BTC seems to always be trading above its own 1W MA50, practically marking a Bull Cycle.
** Important crossroads **
However this time we are in front of important crossroads. That is the DXY being close to its Support, whose hold (and subsequently rebound) last time (January 2018) marked the start of Bitcoin’s last Bear Cycle. So does it mean that a new rebound on DXY’s Support will end BTC’s current Bull Cycle? The obvious and neutral answer would of course be that we can’t know for sure. But what the March 2016 – May 2017 price action on DXY shows us, is that BTC’s Bull Cycle doesn’t necessarily have to end if DXY’s Support holds. And that is because during that period (March 2016 – May 2017), DXY came from trading below its 1W MA50 to above it which resulted into a Resistance test. That test should have theoretically turned BTC bearish but it didn’t, instead Bitcoin continued to rise, in a not so aggressive/ more controlled manner, that paved the way to the final parabolic rise. So this indicates that BTC may have at least another year on its Bull Cycle (the theory of lengthening cycles suggests even more but that’s not the issue of this study), and that we may not have yet seen the really aggressive parabolic phase! Unless of course DXY breaks its Resistance. It goes without saying that if DXY breaks its Support, this will be where Bitcoin could turn really aggressive.
Of course, with Bitcoin being a highly speculative financial asset, driven by strong fundamentals, there are many events that can cause irregularities on these models. Examples of those have been the Libra news (April – June 2019), which caused BTC to rise above its 1W MA50, even though DXY was still trading above its own 1W MA50. Also the COVID meltdown of the March 09, 2020 1W candle, when the global asset-wide sell-off dropped both Bitcoin and DXY below their respective 1W MA50s (DXY recovered shortly after on the next candle though, as investors sought to keep only USD as their safe haven asset).
So what do you think? If DXY holds its Support, do you expect Bitcoin to start reversing and eventually end the Bull Run or will it continue rising on a less aggressive manner as in 2016? Also will a potential Support break on DXY bring an even more aggressive rise on Bitcoin? Feel free to share your work and let me know in the comments section!
Please like, subscribe and share your ideas and charts with the community!
——————————————————————————————————–
!! Donations via TradingView coins also help me a great deal at posting more free trading content and signals here !!
🎉 👍 Shout-out to TradingShot’s 💰 top TradingView Coin donor 💰 this week ==> TradingView
——————————————————————————————————–
Tradingview link:

