

2020
-
DOLLAR INDEX Trading plan on Fed Day
- September 16, 2020
- Posted by: Tradingshot Articles
- Category: Forex
No Comments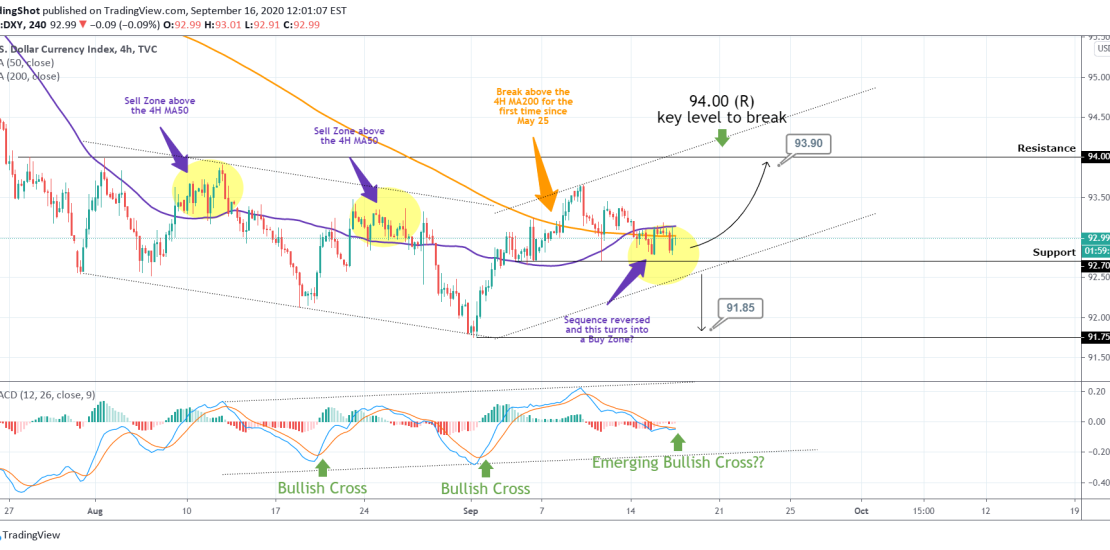
Pattern: Potential Channel Up on 4H. Signal: (A) Buy as long as the Support is intact (B) Sell if the Support breaks. Target: (A) 93.90 (right below the Resistance) (B) 91.85 (right above the Support). *note: Tight SL needed on both ends as the volatility around and after the Fed Rate Decision will most likely
-
BITCOIN going for the 1D MA50 test! Will a break bring a rally?
- September 16, 2020
- Posted by: Tradingshot Articles
- Category: Cryptocurrency
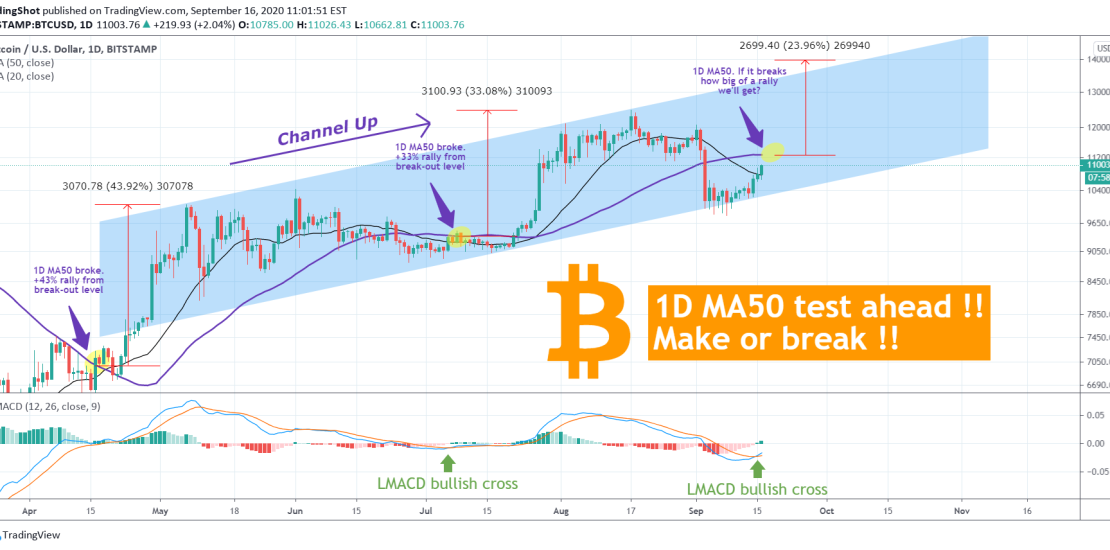
So it appears that Bitcoin successfully defended all possible Support levels, both the Higher Low trend-line of the 1D Channel Up (chart 1) and the 2 year bearish trend-line (chart 2) as seen below: If you think that was the easy part, you are mistaken! BTC traders have to reclaim the 1D MA50
-
XRPUSD Bullish Cross on the LMACD. Eyes on $0.400.
- September 15, 2020
- Posted by: Tradingshot Articles
- Category: Uncategorized
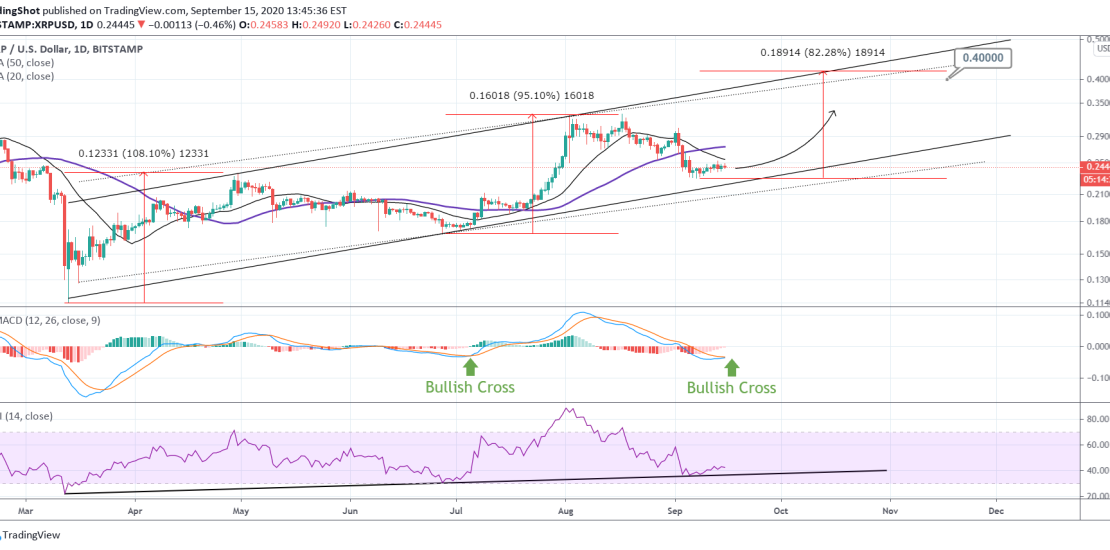
Ripple is trading within a Channel Up since the March bottom. The price is currently consolidating near the Higher Low trend-line but the LMACD has just made a Bullish Cross. Last time that happened, XRP touched the Higher Low trend-line and started the aggressive rebound towards the Higher High trend-line. Notice also how the
-
WTI OIL Buy Signal
- September 15, 2020
- Posted by: Tradingshot Articles
- Category: Uncategorized
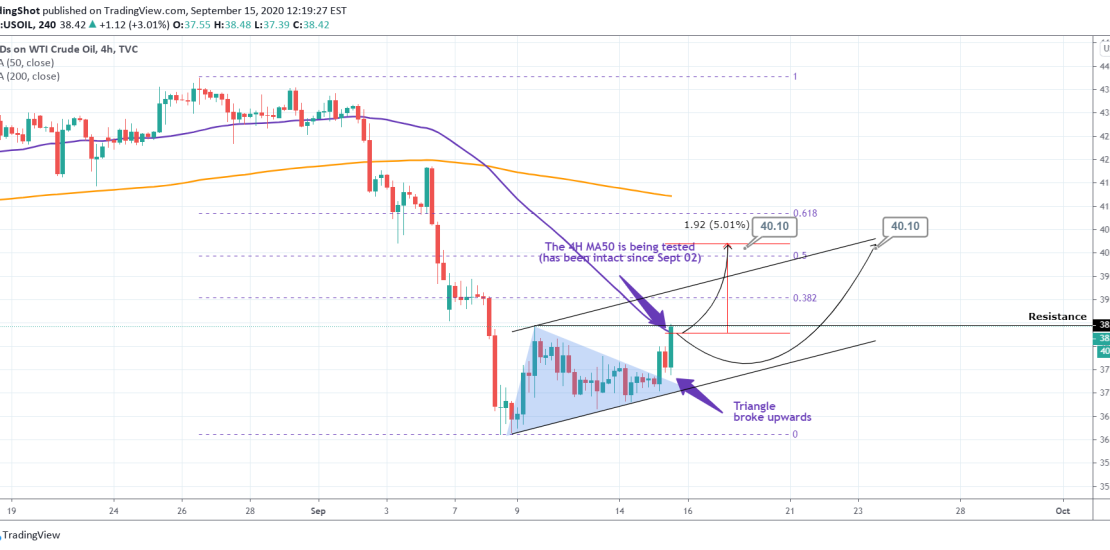
Pattern: Triangle into Channel Up. Signal: Bullish as the Triangle broke, the 4H MA50 has been crossed and the 38.45 Resistance is being tested. Target: 40.10, that is roughly a +5% rise from the 4H MA50 break-out. Sinc June 16, every break-out above the 4H MA50 has resulted into at least a +5.50% rally. **
-
BITCOIN bounced on the 2 year bearish trend-line! Rally ahead?
- September 14, 2020
- Posted by: Tradingshot Articles
- Category: Cryptocurrency
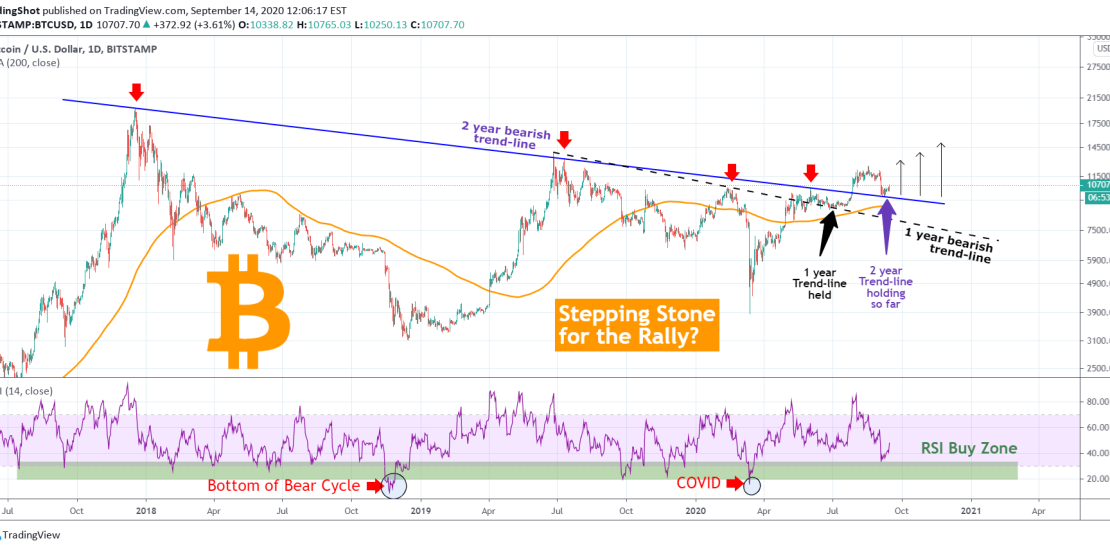
In my opinion Bitcoin is on important cross-roads. As you see on the current 1D chart, the price just made a technical touch (and is currently rebounding) on the 2+ year bearish trend-line (seen in blue) that has been holding since the end of the previous Bull Cycle (December 2017 All Time High) and
-
BITCOIN bringing rally memories to ETHEREUM??
- September 13, 2020
- Posted by: Tradingshot Articles
- Category: Cryptocurrency
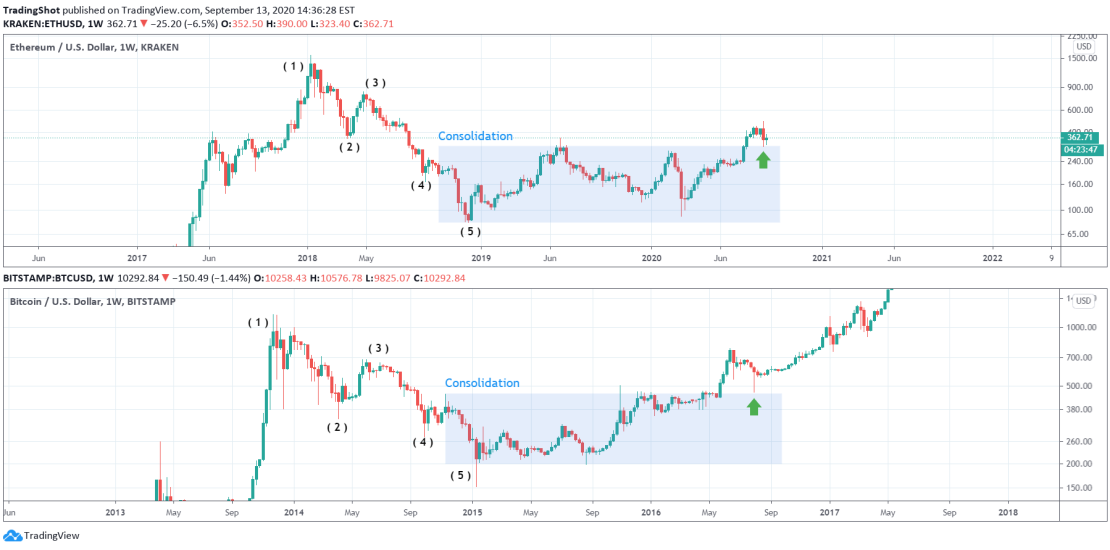
This is an interesting find I came across while comparing ETH’s current cycle on the 1W chart to BTC’s previous (2014 – 2017) Cycle. As you see Ethereum, not only follows Bitcoin’s Bear Market structure but also the consolidation that took place after, which led to the Bull Market rally. When that consolidation broke to
-
S&P We may be starting a new 10 year Bull Cycle!
- September 13, 2020
- Posted by: Tradingshot Articles
- Category: Uncategorized
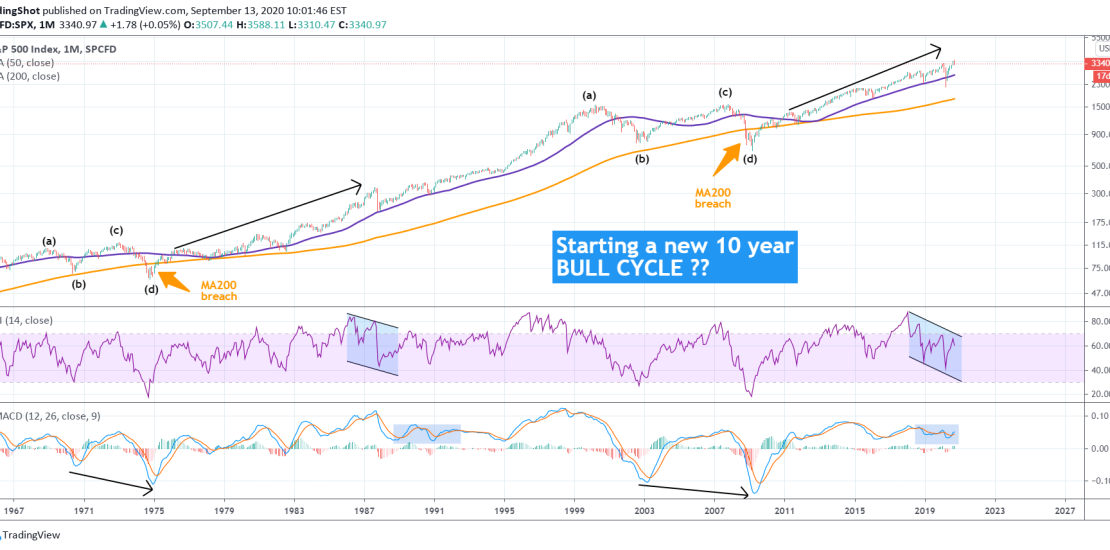
S&P’s weakness in recent weeks has got many thinking that the rally since the March correction is over and that maybe a new round of selling is ahead of us. On such occasions I have found it extremely useful to consult very long-term time-frames (such as the 1M in this instance) and look how
-
BITCOIN How many 1D candle closings above $10000 can we take?
- September 10, 2020
- Posted by: Tradingshot Articles
- Category: Cryptocurrency
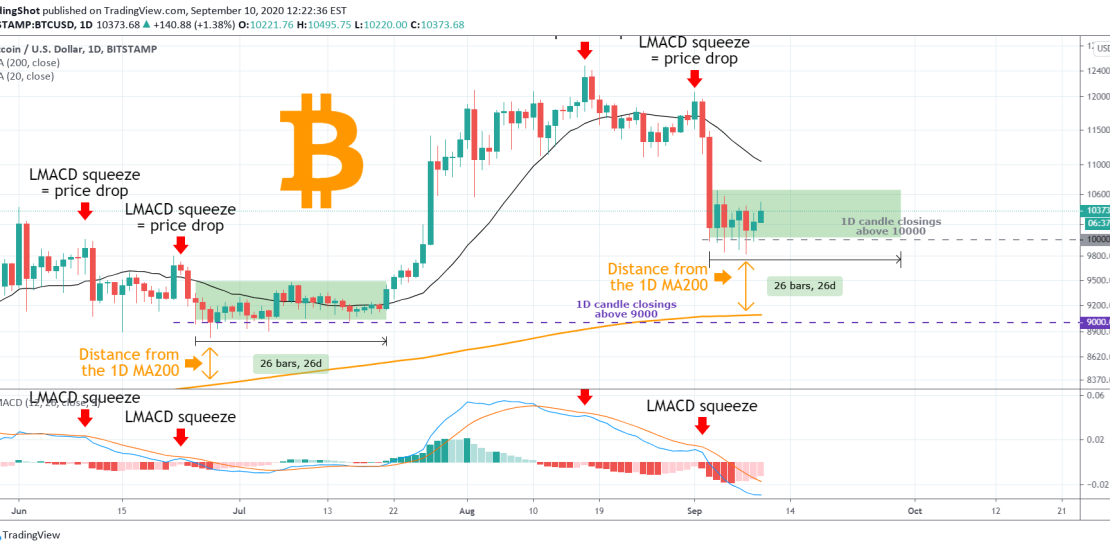
You should have noticed by now that since the September 03 drop, Bitcoin has been consolidating around the $10000 mark. But what may be of particular importance, is the fact that this consolidation never closes a daily candle below that (10000) level. Can this be a coincidence and if not what does it tell
-
BITCOIN The most critical days of the year CAUTION !!!
- September 4, 2020
- Posted by: Tradingshot Articles
- Category: Cryptocurrency
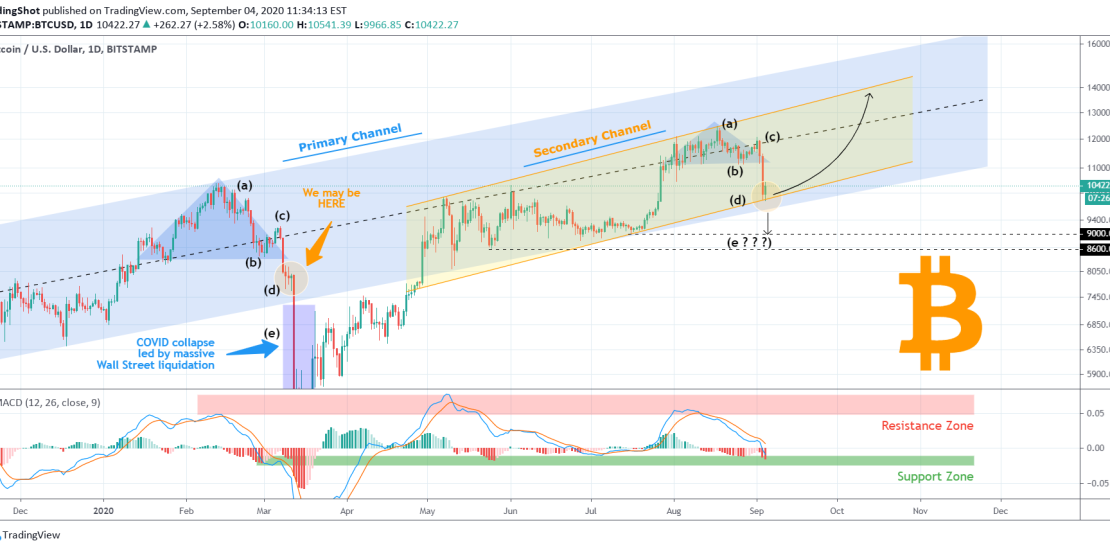
The title may sound a bit dramatic but it is true. Bitcoin is on critical crossroads as it maintains trading within the long-term Channel Up formations but any break lower endangers the effort made after the COVID flash crash. ** Two Channels ** As you see on the chart, there are two main patterns
-
Is Gold about to outperform Silver again for years?
- September 3, 2020
- Posted by: Tradingshot Articles
- Category: Commodities
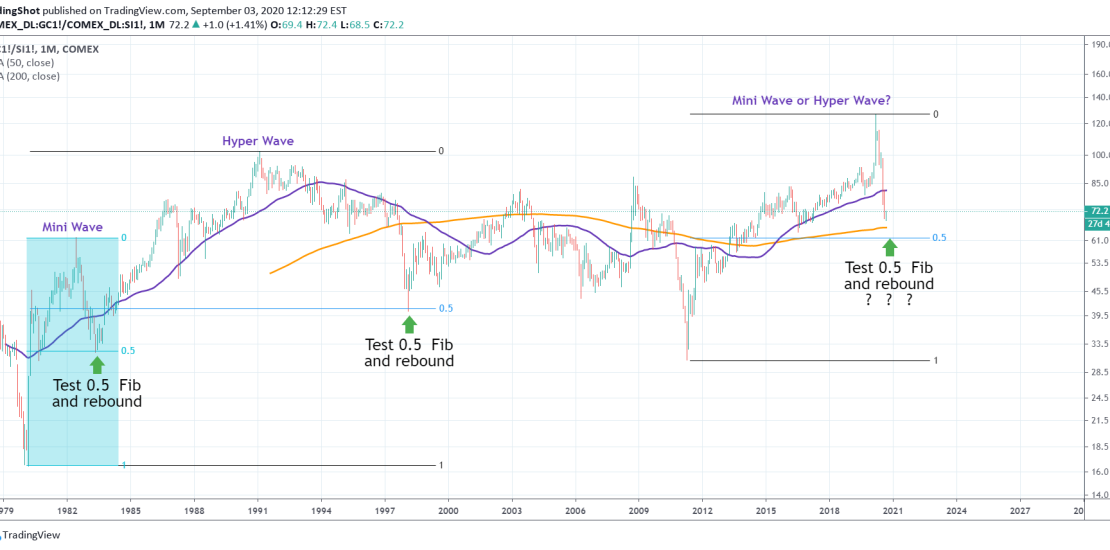
Another simple study of mine looking at the pressure point of the Gold/ Silver ratio. As you see since 1980s, every time GC/SI reaches the 0.5 Fibonacci retracement level, whether it is on a mini wave or hyper wave, the price rebounds strongly and for many years. If the current wave is mini or