

- December 16, 2020
- Posted by: Tradingshot Articles
- Category: Cryptocurrency
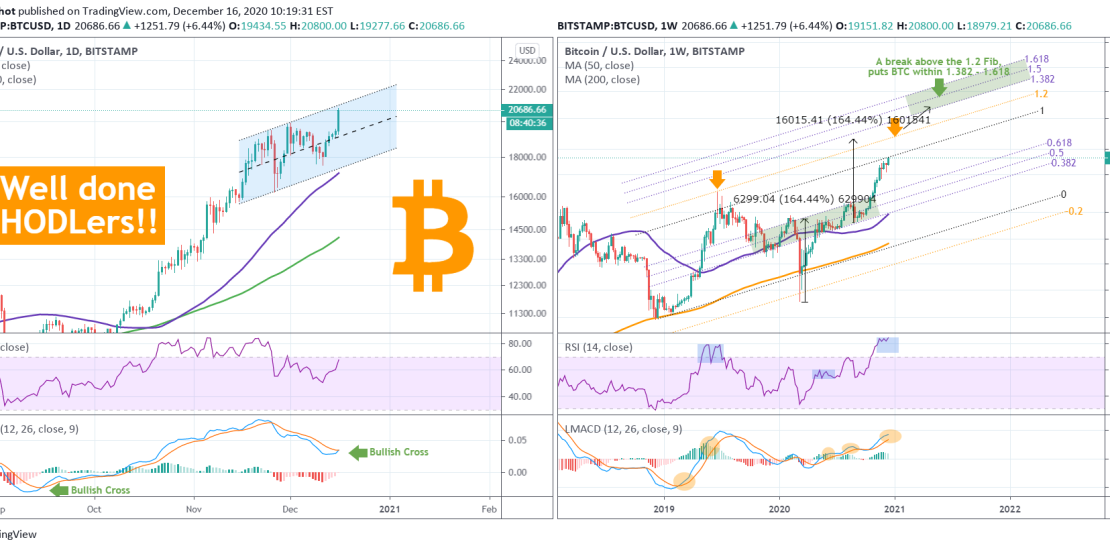
This is a festive post. Bitcoin finally broke the $20000 barrier, so let’s take some lines at least to celebrate. This one is for all the hodlers. For all those who had to endure 3 years of stress, anxiety, discomfort and pain but didn’t lose hope and held. Those who had to sit and listen to people who don’t understand Bitcoin, Blockchain, what it represents, telling them that it’s going to 1k, 100 or even zero! Well my friends congratulations to all, this victory is well deserved, 20k has been captured. But will Bitcoin stop there? After all, as the chart below shows, our first bullish target ($20550) has been hit:

** 1D time-frame, a Channel Up **
Now let’s get on with the technical part quickly before emotions run high. 1D (chart on the left) is a Channel Up. The Channel that held when I posted the following idea on Dec 09, and pushed the price to where it is now:

As long as BTC is within this Channel, chances are most likely testing the middle or even the 1D MA50 (blue trend-line). This should give a chance to people who missed the move to enter. Or those who apply scale trading to add more. But if it breaks, we are moving much higher, as the MACD has just had its first Bullish Cross since September 15, definitely a sign of long-term growth.
** 1W time-frame, Fibonacci Channel **
So that if the 1D Channel Up breaks to the upside. In that (very likely) case, I have to take you out on the 1W time-frame (right chart) where I’m using my favorite and very reliable Fib Channel tool. As I’ve analyzed this extensively in the past, this Channel has had two candle wick breaks, one to the upside and one to the downside. Both where done under extreme fundamentals events, the first (June 2019) was under the Libra effect, the second (March 2020) was a direct result of the COVID sell-off.
A “Libra” wick has the potential to post a 1W candle as high as the 1.2 Fibonacci extension without breaking the formation. That means that we can move to anywhere between $25000 and $27000 without breaking the pattern. If however the 1.2 Fib breaks, I expect trading within the 1.382 – 1.618 Fib extensions (most likely Q1-Q2 2021). Why the 1.382 – 1.618 zone is important? Because that’s where most of the Channel’s price action (highest volatility) was.
High chances for that wick happening as the RSI is printing a formation similar to June 2019. Also the LMACD is having its highest Bullish Gap since June 2019, while all other similar LMACD formations since 2019 have delivered a strong rise within a month.
Enough analysis. Again congratulations to all! Let me see words of celebration in the comments section below!!
** Please support this idea with your likes and comments, it is the best way to keep it relevant and support me. **
——————————————————————————————————–
!! Donations via TradingView coins also help me a great deal at posting more free trading content and signals here !!
🎉 👍 Shout-out to TradingShot’s 💰 top TradingView Coin donor 💰 this week ==> TradingView
——————————————————————————————————–
Tradingview link: