- October 16, 2020
- Posted by: Tradingshot Articles
- Category: Cryptocurrency

There has been much talk lately about the relationship of Bitcoin and the USD. I have even published a chart last month (September 27 the original that was deleted and I re-posted it last week) analyzing the relationship on BTC with the USD and the Money Supply:
In this study I will examine the correlation of BTC and stocks (S&P in particular) to the USD (Dollar Index: DXY).
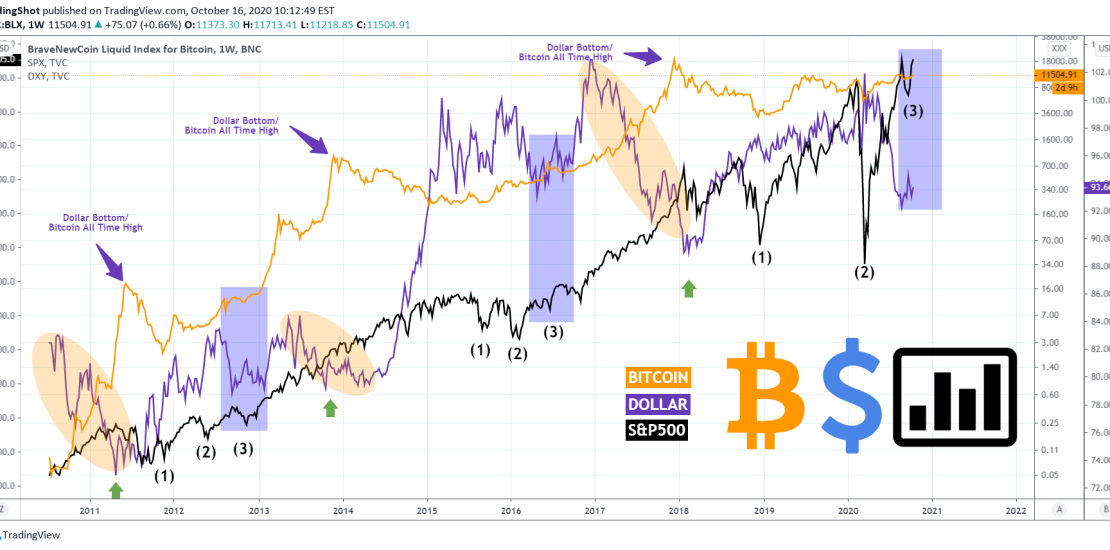
** When Dollar Bottoms, Bitcoin makes All Time High **
As seen on the chart (even though absolute correlation is not the rule), generally when DXY (blue line) makes a bottom after a strong and lengthy (usually 12 months) downtrend (the orange ellipse), BTC (orange line) makes a Cycle Top (or All Time High/ ATH). However this is not always true (Bitcoin rising only when DXY is falling) as there have been numerous instances when both BTC and DXY increased simultaneously (October-December 2011, April-July 2012, February-April 2013, May-December 2016, January-April 2019, December 2019-February 2020).
** The stock market 1, 2, 3 count **
So if this correlation with DXY isn’t absolute, what makes BTC rise when DXY also rises? A lot has to do with the stock market (black line). Stocks do rally when cash is cheap (as seen recently with the massive stimulus) but when economic growth is healthy, the stock market can continue rising even when the DXY rallies. What is even more interesting is that the stock market can make systemic corrections when DXY is on a low (i.e. August 2011, September 2015, March 2018).
What I’ve found on this cross study is that, after the DXY makes a bottom, the first three corrections (1, 2, 3 count) on the stock market that follow are highlighted by extreme market volatility but serve as an accumulation region for a lengthy (and very aggressive) Bull Phase that follows.
Of course with the effect of the COVID pandemic devastating, the current count (2) was far more aggressive than that of the previous Cycles but still remains valid. As you see DXY appears to have currently bottomed and stocks made count (3). It is therefore possible to see in the coming months both Bitcoin and stocks rise along with DXY, before the latter makes a new sharp decline (orange ellipse) which should be the new ATH for BTC. Of course this won’t be a matter of a few months but around 1.5 – 2 years.
What do you think? Do you agree with the above data-set showing that all three are about to rise in the coming months? Feel free to share your work and let me know in the comments section!
Please like, subscribe and share your ideas and charts with the community!
——————————————————————————————————–
!! Donations via TradingView coins also help me a great deal at posting more free trading content and signals here !!
🎉 👍 Shout-out to TradingShot’s 💰 top TradingView Coin donor 💰 this week ==> AxelShadah
——————————————————————————————————–
Tradingview link:


